|
Melbourne, FL
Experience: Advanced
Platform: NinjaTrader, ThinkOrSwim
Trading: Futures, Options, Stocks
Posts: 19 since Jul 2020
Thanks Given: 4
Thanks Received: 2
|
History
I started getting back into trading (or, studying trading, brushing up) when the pandemic hit, I was in lockdown, and was looking for something to do.
I had previously traded stocks and options during the oughts, and stopped around 2010, beating. the market overall (with a lot of help from Apple  ) )
I dipped my toe into equity futures trading, and soon came to the conclusion that my micro-bankroll wasn't sufficient to trade even the micros.
I worked on this strategy for 6-9 months, had some success with it (on paper), but profit factor wasn't quite good enough, and then stopped around mid-2021.
I restarted development in fall of 2023, and recently got to a point where it looks viable enough to try live trading it.
One thing that's causing me a bit of hesitation: the positive results shown below are from trades on Micro eMini S&P (MES). When I tried using comparable settings on the MNQ, it was a disaster--losing worse than the strat wins on MES. It's possible adjusting strat settings, changing tick size, or using different bar type, might help, but to me it's kind of disturbing that it doesn't even break even.
Strat Description
I'm not going to give granular details, like specific indicators used, just a broad outline.
The strat is best described as: stop-and-reverse, trend-following.
It looks for lasting trends throughout the regular session--usually 30 min up to 6 hours (assuming the whole day trends).
It's not pure SAR--using filters to avoid entry when the market is sideways.
Half the strat is this technical part.
The other half is money management.
I wrote my own functions to auto-exit once a max session loss is hit. And another profit-stop-loss function triggered when a profit target is hit, which exits at an 'x' % drawdown from that profit.
You could say the strat uses a 'shotgun approach', taking every reasonable entry looking for a sustained trend. Because of this, most days are losers.
But when it locks onto a trend, it hits home-runs, making up for the losing days.
Bar size is 2000 tick.
As for contract size: I'm currently entering with 6 contracts. 3 are runners which chase my main trend indicator. 3 are early exits, which get hit when price crosses a faster-moving indicator on pullbacks.
This approach (using trailing stops) has worked best. I did a lot of testing with targets, and they seem to leave a lot of profit on the table compared with a trailing stop approach. I've come to the conclusion that targets are best for short-term scalping, rather than trend-following.
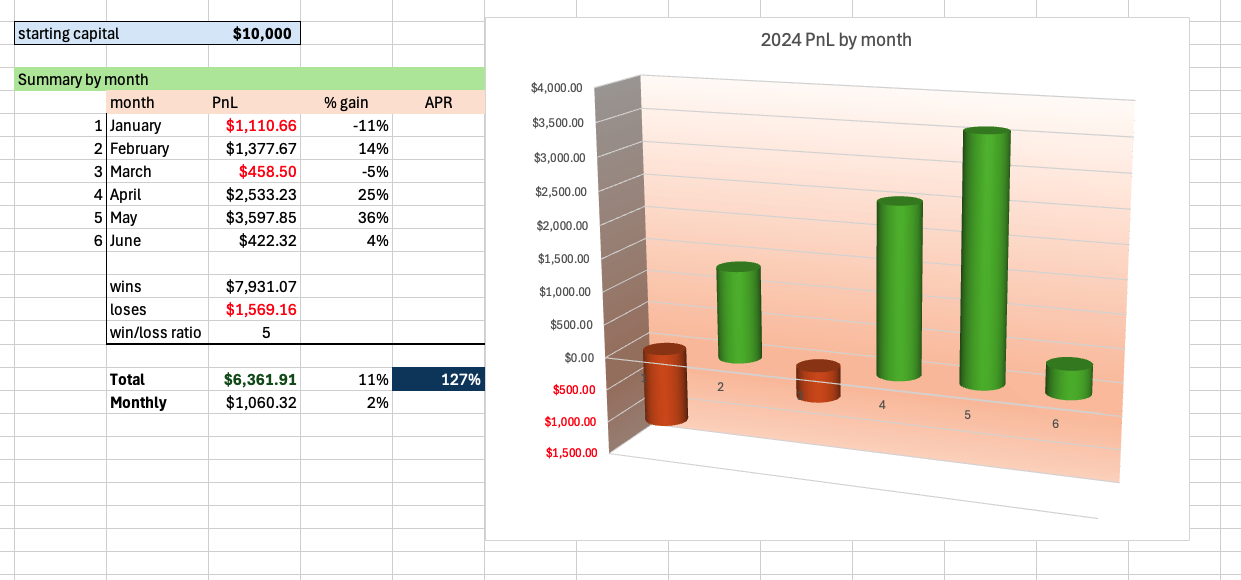
Any way, here are my results for 2024. I understand it's a tiny sample size. But I'm hoping if I live trade it, I'll at least break even and be able to continue to develop improvements.
I did not use a backtester/optimizer (as the one built-in to my platform is pretty flaky). I walked forward through each day manually with the replayer.
Any comments appreciated.
I'd be curious to know if anyone else's results (re: bad months, good months with ES/MES in 2024) align with mine.
RESULTS
summary
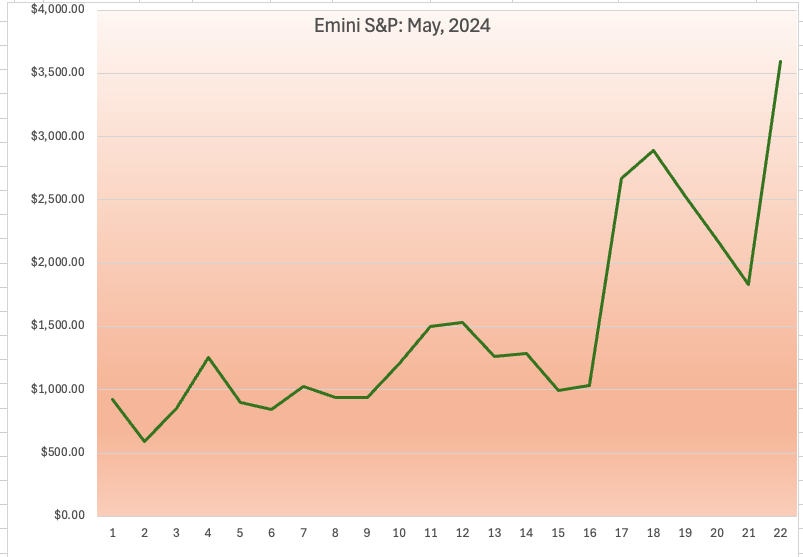
best month
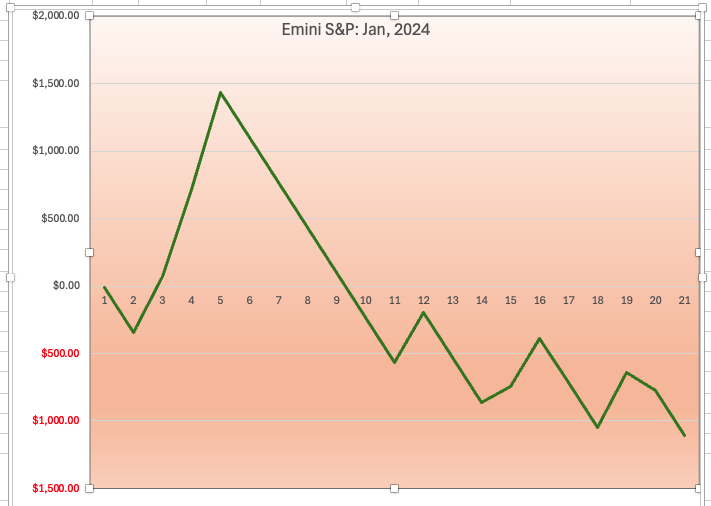
worst month
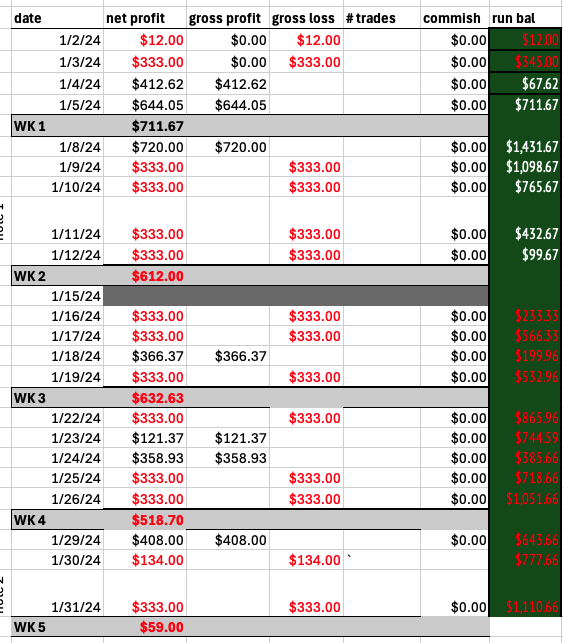
daily
|


