Welcome to NexusFi: the best trading community on the planet, with over 150,000 members Sign Up Now for Free
Genuine reviews from real traders, not fake reviews from stealth vendors
Quality education from leading professional traders
We are a friendly, helpful, and positive community
We do not tolerate rude behavior, trolling, or vendors advertising in posts
We are here to help, just let us know what you need
You'll need to register in order to view the content of the threads and start contributing to our community. It's free for basic access, or support us by becoming an Elite Member -- see if you qualify for a discount below.
-- Big Mike, Site Administrator
(If you already have an account, login at the top of the page)
I don't really know the answer to your question. When I was using Better Volume I was only using the HVC & LV bars, I turned the climax up & down off. Now I'm not using better volume, he has a new volume indicator which has replaced it called "Pro Am" and I have made my own paintbar which is very similar. There are better ways to detect professional activity than just the HVC. Sometimes but not always there is HVC at a turn, but almost always there are other signs of professionals fading the move before the turn. An example from yesterday's chart:
Can you help answer these questions from other members on NexusFi?
A churn bar is not necessarily a low range bar. The criterion for churning is range per volume. So even a wide ranging bar can become a churn bar, if the volume is excessively high. So if you have a wide ranging high volume bar it can comply with both the necessary conditions volume x range > average (volume x range) and volume per range > average volume per range.
What does a volume churn bar mean?
Imagine on a 5 minute chart that you have a bullish move with a climax bar followed by a churn bar. The climax bar stands for the end of a parabolic move. The churn bar that follows shows that there is resistance as sellers are stepping in. This is called stopping volume. The sellers are passive and sell at the ask, but they are strong enough to stop the move. The selling is the start of a distribution pattern. Often price will stay in a trading range then the bulls will regain force and you will see a final flag or bull trap.
Now how does this display on a 10 min chart. The 5 min expansion bar (wide range, high volume) and the 5 min churn bar (narrow range, high volume) will combine to form a 10 min climax churn bar.
PT, St, ND & NS = He has talked about these individually in the past. I had already coded some of them up. If you search his blog there are posts about them and he gave away the code.
Rambo is a new one and from what I see it's just an amateur bar making a new high. Usually this occurs from amateur breakout traders (I'm one of them on the dax hehe).
The pro & amateur is a bit more complicated. In my version I use 3 algorithms to determine professional & amateur activity in 5 levels. My results are therefore different than Barry's Pro Am paintbar. I made mine because I wanted it for Ninjatrader and wanted to be able to use the logic in strategies.
Not a reply, more a cry for help! New to volume and price analysis and currently have a provider (ToS) that doesn't offer range bar charts. Downloaded the VSA indicator and been looking at that. Get the Kruger weekly vid too.
On a day like today when trading (in the ES) was relatively constrained-both in price movement and volume I was wondering whether range bars might have helped negate some of the chop.
Be grateful if somebody could kindly post an ES range bar chart-(ideally candlesticks) so i can compare and contrast.
I'm guessing, but say 8 ticks?
Many thanks
The Gnome
David_R
San Jose, Ca
Legendary Market Wizard
Experience: Beginner
Platform: Ninja
Broker: AMP/CQG
Trading: Something moving
Posts: 1,582 since Nov 2009
Thanks Given: 2,335
Thanks Received: 2,524
Here is a 4 range and and an 8 range (right)
d
GardenGnome01
UK
Posts: 7 since Jul 2010
Thanks Given: 0
Thanks Received: 1
Many thanks: bang on the money!!
Fat Tails
Berlin, Europe
Market Wizard
Experience: Advanced
Platform: NinjaTrader, MultiCharts
Broker: Interactive Brokers
Trading: Keyboard
Posts: 9,888 since Mar 2010
Thanks Given: 4,242
Thanks Received: 27,103
If you are a gnome that was your day today, was it? The forth consecutive gnome range. I think today range bars would not have changed very much. And 8 ticks seems a lot for the price action of today.
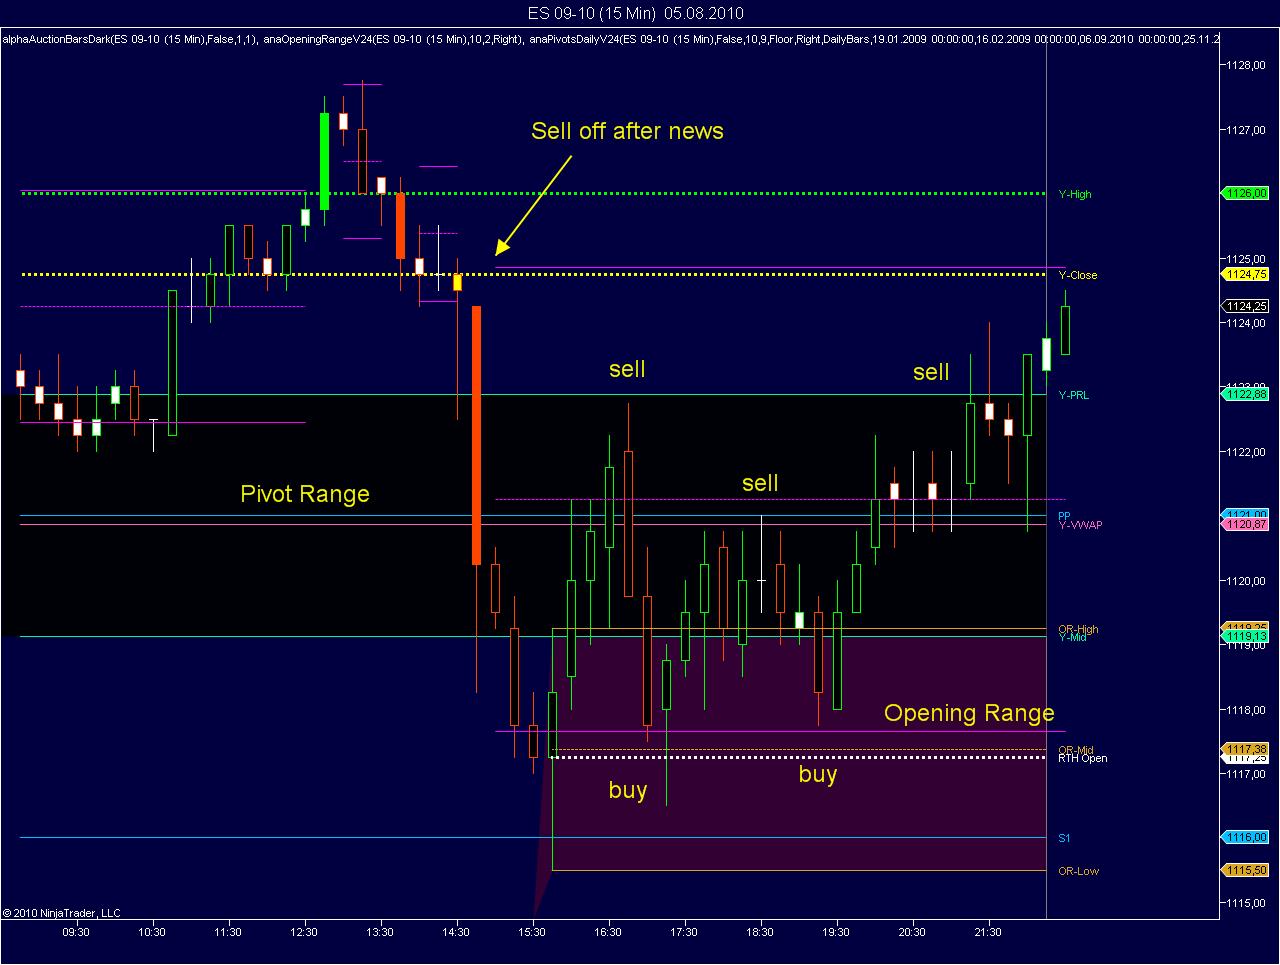
There was a sell off after the news release. Expectation for tomoorow remains low, so there was little hope that price would recover. Only thing to do: Watch the opening range and the pivot range. Buy at the RTH open, sell or buy the main pivot, sell the upper border of the pivot range. A bit of playing ping pong.
GardenGnome01
UK
Posts: 7 since Jul 2010
Thanks Given: 0
Thanks Received: 1
Thank you FT- a work of art in itself!!
-maybe I'll give up the 5 min candles!
Fat Tails
Berlin, Europe
Market Wizard
Experience: Advanced
Platform: NinjaTrader, MultiCharts
Broker: Interactive Brokers
Trading: Keyboard
Posts: 9,888 since Mar 2010
Thanks Given: 4,242
Thanks Received: 27,103
I use 5 min candles as well, just use 15 min for the daily picture. Always afraid not to see the wood for the trees.


 I think today range bars would not have changed very much. And 8 ticks seems a lot for the