You are absolutely correct...that would be a heck of a stressful time from Aug 18 to Sept 1.... In your discussion here we are relying on a single indicator and that is very risky and also is the reason why most traders fail when using indicators.
I looked at the chart again and found that Stockcharts.com has changed it slightly... early in the week I noticed there was trouble with several charts I was looking at... this was disconcerting and the first time I found bad charts on this site.... nothing much has changed as far as your question but I will redraw the chart as it should have been....
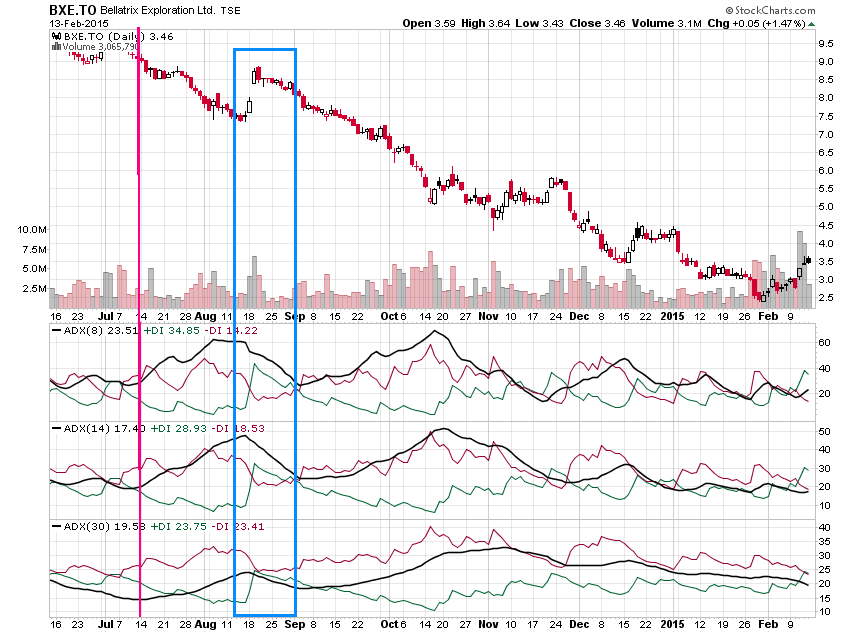
If I were doing it though with JUST ADX30 as my indicator... I would have had to be psychic to catch that
spike. But I would not have panicked and sold...I think so anyway as I do not short stocks as a firm rule.... but the principle is the same if a
bullish stock too a dive very suddenly. The ADX30 DI+/- however did not cross when that jump happened... So I would have used a Limit Buy on
Stop order to protect myself from disaster....
NOTE: we have not lost principle with that jump.... we only lost profit.... I would have set that protection to sell if the stock hit a
range from $9.00 to $9.10.... if it trips we still make a very small profit.... but as you can see the price rose no further...this is the way I take emotion out of an exit from a position.... if the stop trips fine but you give it a chance to resume making more profit
ALL indicators lie at one time or another.... but they all don't lie at the same time if you choose wisely.
That is why I don't rely on simply a single indicator... If you check out my Canadian Journal starting here you will see a discussion on what I call my "trigger chart". In reality I use 4 charts to come to a conclusion, taking a consensus of all the indicators and I use 8 indicators not counting an
Ichimoku chart. I also use 3-4 overlays...not the least being Bollinger Bands. I have only really discussed the "trigger chart" though in gory detail so far
You can find that discussion here
First I am going to repeat the analysis of this company focusing on that time range of interest. And show you how I would have accessed the situation
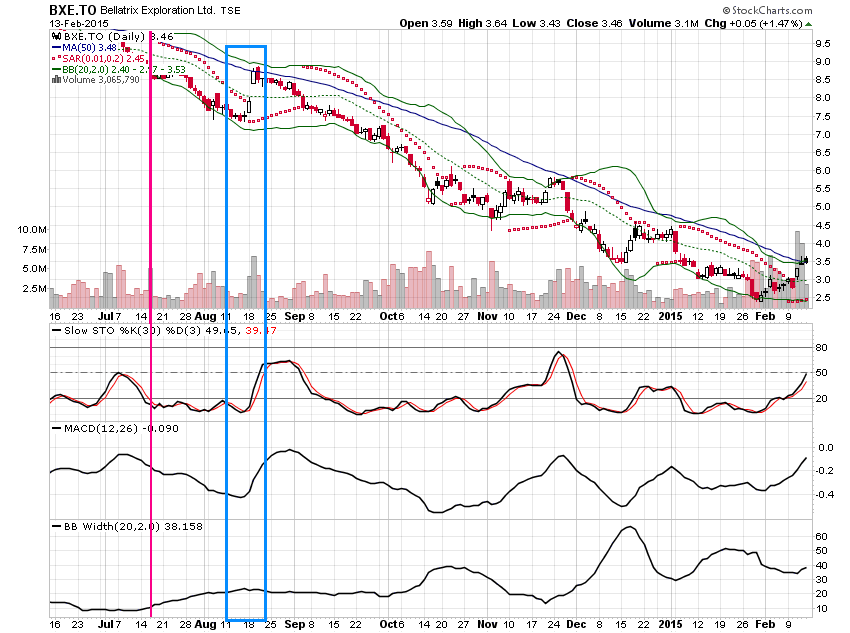
this is my Trigger chart.... the rules are (note the parameters on the Slow Sto and MACD)
1. If Slow Sto and MACD rise and the BBWidth suddenly rises... this is a Bullish signal to buy
2. If Slow Sto and MACD fall and the BBWidth suddenly rises... this is a
Bearish signal to short
now in real life I would depend on this chart to determine when to make a move and here I would have delayed a couple of days to make sure the rule #2 was completed and even then it is not a real clear signal but not bad.
3. If the Slow Sto and MACD are falling and the BBwidth falls then the Bull run MIGHT be over (we enter a consolidation phase and the next major
breakout happens when the BBwidth reaches its "trigger" level... ALL three must be neg slope to signal the end)
4. If the Slow Sto and MACD are rising and the BBwidth falls then the Bear run MIGHT be over (we enter a consolidation phase and the next major breakout would happen when the BBwidth reaches its "trigger" level... ALL BBwidth must be neg slope and the other two rising to signal the end)
look at the chart on leading up to Aug 18.... the Slo Sto and MACD ARE rising.... but look at the BBwidth... it has plateaued... not fallen....
this is not a sign to
cover the short.... the BBwidth remains
flat as the crisis is over and you note in early Oct the sudden rise of the BBwidth a sign that the short is continuing... there is a head fake on late November... but see how quickly the MACD and Slow Sto
reverse...(also note the price is above the Upper Bollie...not a great sign for a breakout.)
Now to the present... see rule # 1 beginning.... time to cover the short.
But let us look at another chart... I call this my sentiment chart
again note the parameters I use
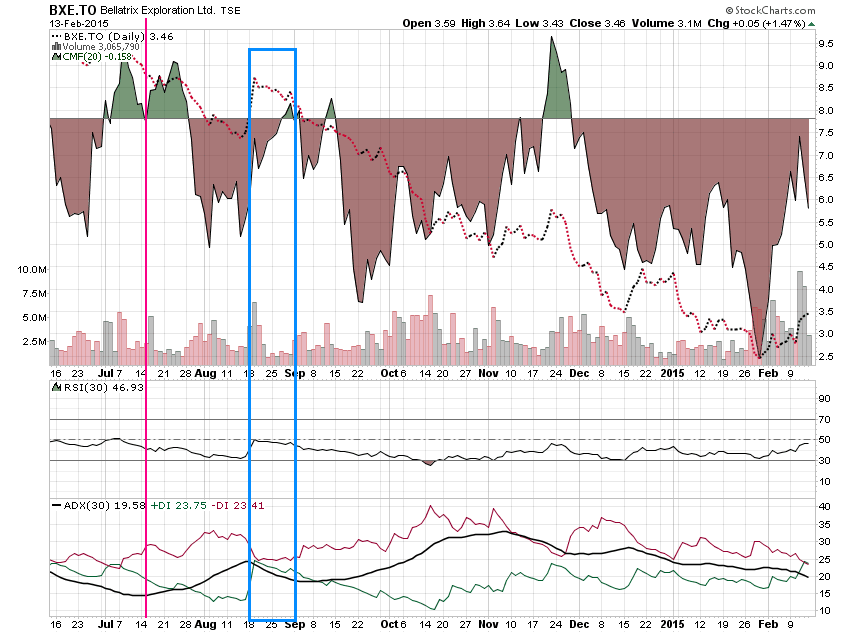
If I were looking for an entry point JUST looking at this chart I could have probably moved it back 2-3 days... But I rely on the BBwidth breakout for most buys/sells.... this chart is used for confirmations
Look at the RSI(30).... Se how it tried to get over 50 and on July 14 it is definitely trending downward? Bearish
See the CMF(20) overlay... it is trending to below zero (though that reverses quickly) mildly bearish at the time...
The ADX(30) is full on bearish.... this confirms the decision to short made in the last chart.
On Aug 18... see the sudden climb of the RSI(30).... but it stops at 50 and declines slowly from there (very mildly bearish)
See how the sudden climb of share price the CMF(20) rises but does not get out of the mud until the end of that worrysome period and declines suddenly afterward... (very mildly bullish)
The ADX(30) DI+/- never crosses and had a bearish divergence toward the end
SO...when you assemble the evidence it is not a compelling reason to end the short... HOWEVER to protect yourself you put in a Limit Stop Buy order...just in case... You can trail it as the price falls downward if you really want to cover the short ... but as the evidence shows the short in full force I would eventually cancel the order.
I will stop here as this post is long enough for now but you see how by gathering evidence from a number of indicator sources you can arrive at an intelligent decision with a reduction of risk.
You ask very good questions...I wish you would ask them in my journals for all to benefit

I hope this answer helps you...


