NexusFi: Find Your Edge


Home Menu


CLASSIC DELTA DIVERGENCE


Discussion in Traders Hideout

Updated
      Top Posters
    1. looks_one tigertrader with 6 posts (7 thanks)
    2. looks_two Fat Tails with 4 posts (2 thanks)
    3. looks_3 Quick Summary with 1 posts (0 thanks)
    4. looks_4 aviat72 with 1 posts (0 thanks)
    1. trending_up 18,756 views
    2. thumb_up 9 thanks given
    3. group 5 followers
    1. forum 12 posts
    2. attach_file 4 attachments


Search this Thread
  #1 (permalink)
 
tigertrader's Avatar
 tigertrader 
Philly, Pa
Legendary Market Wizard
 
Experience: Master
Platform: NinjaTrader
Trading: ES, ZB
Posts: 6,482 since Jul 2010
Thanks Given: 6,662
Thanks Received: 36,267

Classic example of delta divergence. New high, but negative cumulative delta. 1179 was also the 500ma on the 15m.

“Delta Divergences” can take many forms, but ultimately they show only one thing: the convictions of traders’ choices do NOT match price movement. There is behavioral incongruence. Essentially, for a given price movement, there is a lack of aggressiveness which is normally needed (and associated with) to support continued price movement in a particular direction. In addition to the bar-by-bar type divergence shown above, divergences can occur over a sequence of an arbitrary number of bars.

Also note that the 2 bars preceding the 10:05 bar are relatively short bars. Bottoms and tops will more often be composed of longer bars than mid-range pivot points. The engulfing candle at 10:05 is noticeably longer and represents extreme prices being rejected.

The bar before the engulfing bar shows a positive cumulative delta, yet the best the price can do is is move up 1 tick from the buying. Next thing you know, the buying turns into strong selling, representing a failed auction. In addition, this occurs at a price level of significance (500MA) which makes this a high probability short entry.

It's even more evident on a 30 min chart. Huge engulfing candle with a huge negative cumulative delta. The pink dotted line is the bottom of value,the black dotted line is the top of the opening range, and the orange ine is the VWAP. Notice the market pulls back to the VWAP twice and gives you a nice entry.

Market profile confirms and also gives you a sell signal @1179 which is bottom of yesterday's value area.


Attached Thumbnails
Click image for larger version

Name:	ES 12-10  10_27_2010 (5 Min).jpg
Views:	1098
Size:	259.6 KB
ID:	24308   Click image for larger version

Name:	mp.jpg
Views:	805
Size:	161.2 KB
ID:	24352   Click image for larger version

Name:	md.jpg
Views:	776
Size:	223.9 KB
ID:	24357  
Follow me on X Started this thread Reply With Quote

Can you help answer these questions
from other members on NexusFi?
White House Drops First Alien Files Today -- Market Says …
Prediction Markets & Event Contracts
CFTC Rewrites the Rulebook -- Kalshi Cracks $1B Non-Spor …
Prediction Markets & Event Contracts
CME Raises Energy Futures Margins After Iran-War Volatil …
Commodities
More Than Capable: Hegseths War Warning Validates $114M …
Prediction Markets & Event Contracts
Post-Summit Market Verdict: ES -1%, NQ -1.5%, 10-Year Yi …
Traders Hideout
 
Best Threads (Most Thanked)
in the last 7 days on NexusFi
Darmok and Jalad at Tanagra
1 thanks
NexusFi site changelog and issues/problem reporting
1 thanks
  #3 (permalink)
 
Fat Tails's Avatar
 Fat Tails 
Berlin, Europe
Legendary Market Wizard
 
Experience: Advanced
Platform: NinjaTrader
Broker: Interactive Brokers
Trading: Futures & Stocks
Posts: 9,887 since Mar 2010
Thanks Given: 4,242
Thanks Received: 27,117


I am not that familiar with delta divergences. What I see is that after the high was made, the bar closed down, hitting support at 1175.75. The down bar was also a bearish engulfing pattern. In my opinion this is not a divergence, as the same information can be obtained from the bar. But I am not sure, as I do not use market delta.

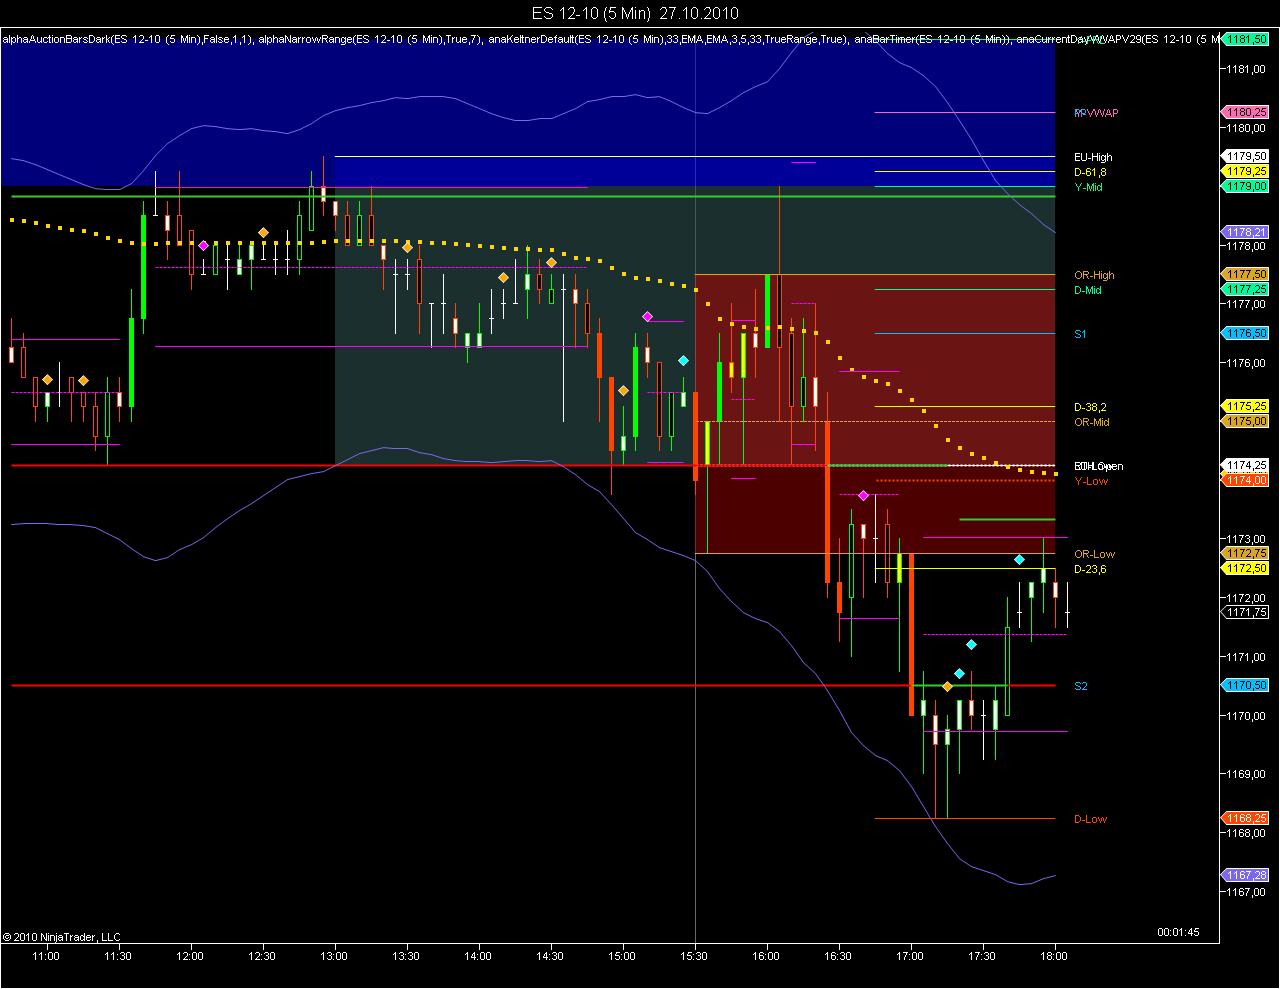
The high of the day was made when ES hit overhead resistance: The pivot range (yesterday's midline) and a major fibonacci line contained the bulls which quickly became the prey of the bears. You could have traded the massive resistance as well.


Reply With Quote
Thanked by:
  #4 (permalink)
 
tigertrader's Avatar
 tigertrader 
Philly, Pa
Legendary Market Wizard
 
Experience: Master
Platform: NinjaTrader
Trading: ES, ZB
Posts: 6,482 since Jul 2010
Thanks Given: 6,662
Thanks Received: 36,267

All the better!!!


Follow me on X Started this thread Reply With Quote
  #5 (permalink)
 
Fat Tails's Avatar
 Fat Tails 
Berlin, Europe
Legendary Market Wizard
 
Experience: Advanced
Platform: NinjaTrader
Broker: Interactive Brokers
Trading: Futures & Stocks
Posts: 9,887 since Mar 2010
Thanks Given: 4,242
Thanks Received: 27,117


tigertrader View Post
All the better!!!

However, have not understood, what is "500MA". Can you explain it?


Reply With Quote
  #6 (permalink)
 
tigertrader's Avatar
 tigertrader 
Philly, Pa
Legendary Market Wizard
 
Experience: Master
Platform: NinjaTrader
Trading: ES, ZB
Posts: 6,482 since Jul 2010
Thanks Given: 6,662
Thanks Received: 36,267

500 period moving average


Follow me on X Started this thread Reply With Quote
Thanked by:
  #7 (permalink)
 
Fat Tails's Avatar
 Fat Tails 
Berlin, Europe
Legendary Market Wizard
 
Experience: Advanced
Platform: NinjaTrader
Broker: Interactive Brokers
Trading: Futures & Stocks
Posts: 9,887 since Mar 2010
Thanks Given: 4,242
Thanks Received: 27,117


tigertrader View Post
500 period moving average

Yep, but what timeframe, SMA or EMA. I did not find it.


Reply With Quote
  #8 (permalink)
 
tigertrader's Avatar
 tigertrader 
Philly, Pa
Legendary Market Wizard
 
Experience: Master
Platform: NinjaTrader
Trading: ES, ZB
Posts: 6,482 since Jul 2010
Thanks Given: 6,662
Thanks Received: 36,267

sma on a 15 min chart, mein Freund.


Follow me on X Started this thread Reply With Quote
Thanked by:
  #9 (permalink)
 
Fat Tails's Avatar
 Fat Tails 
Berlin, Europe
Legendary Market Wizard
 
Experience: Advanced
Platform: NinjaTrader
Broker: Interactive Brokers
Trading: Futures & Stocks
Posts: 9,887 since Mar 2010
Thanks Given: 4,242
Thanks Received: 27,117


tigertrader View Post
sma on a 15 min chart, mein Freund.

How do I know that you refer to a 15 min chart? Your chart attached was 5 min. As the 500 days SMA lingers somewhere in the distance further south, I did not want to check all the various timeframes available.


Reply With Quote
  #10 (permalink)
 aviat72 
San Francisco Bay Area
 
Experience: Intermediate
Platform: NT,TOS,IB
Trading: ES,CL,TF
Posts: 281 since Jun 2010
Thanks Given: 161
Thanks Received: 273


tigertrader:
What is the MP indicator you are using on the second chart?


Visit my NexusFi Trade Journal Reply With Quote


Last Updated on August 26, 2016


© 2026 NexusFi®, s.a., All Rights Reserved.
Av Ricardo J. Alfaro, Century Tower, Panama City, Panama, Ph: +507 833-9432 (Panama and Intl), +1 888-312-3001 (USA and Canada)
All information is for educational use only and is not investment advice. There is a substantial risk of loss in trading commodity futures, stocks, options and foreign exchange products. Past performance is not indicative of future results.
About Us - Contact Us - Site Rules, Acceptable Use, and Terms and Conditions - Downloads - Top
no new posts