Welcome to NexusFi: the best trading community on the planet, with over 150,000 members Sign Up Now for Free
Genuine reviews from real traders, not fake reviews from stealth vendors
Quality education from leading professional traders
We are a friendly, helpful, and positive community
We do not tolerate rude behavior, trolling, or vendors advertising in posts
We are here to help, just let us know what you need
You'll need to register in order to view the content of the threads and start contributing to our community. It's free for basic access, or support us by becoming an Elite Member -- see if you qualify for a discount below.
-- Big Mike, Site Administrator
(If you already have an account, login at the top of the page)
You wanna teach us how to trade like you? What's the reason doing so? Or it's just an ad of what you can?
You have to wait a little time to get attention of others users to this topic. It's summer time and people on vacations. There was nothing written on this branch of the forum for a long time.
Can you help answer these questions from other members on NexusFi?
First of all let me thank you, Bloom, and everyone participated/ing in this thread.
Personally for me this one was an eye-opener and I greatly appreciate all the energy input made here.
Bloom, I found a huge missing part of my understanding of markets here. Still there's lots of mess in my head, but hopefully all the dust will settle sooner or later. Thanks for your job and starting this thread!
Few questions here, shall appreciate if you could share your thoughts:
1. I have not yet finished reading all the thread, but already the most difficult part for me is following the numbers. All the time I read in this thread something like "orders were pulled", "filled" etc.. How can you actually see those figures movements in DOM?? The numbers are jumping like crazy, orders can be pulled and installed again several time in a couple seconds, levels are jumping as well. Is it only practice, or some kind of software/indicator?
2. Does the upgraded T&S (which aggregates trades) really make sense, or regular T&S is enough (currently I'm watching NT8 "100 filtered" T&S trades and plain T&S trades windows).
3. Psychological problem I experience:
Once started watching T&S and DOM suddenly I realized that I'm biased while watching chart: I create a picture in my mind of expected price movement and try to follow Order Flow technics in those "boundaries" trying to find proof of my view. Hence missing trades and getting losses. Currently it's probably impossible for me not to watch charts. How do/did you overcome such a thing if had any?
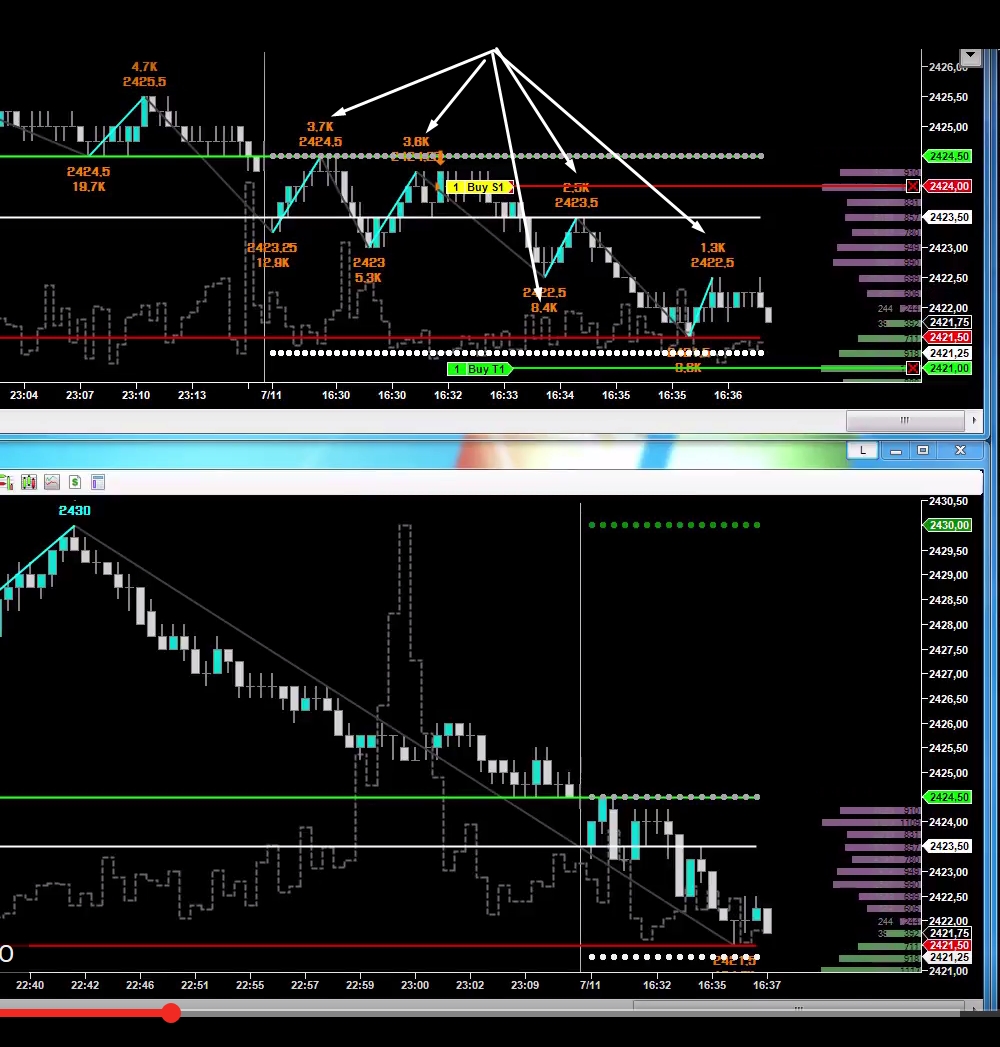
This is a Price Action Swing indicator witn a volume needed to create current swing.
2423.25 - 2424.5 and 3.7 k contracts needed to move price this far
What do you mean than say "following the numbers". Cover this in details as process. What and than you do
I do not need to watch it all the time the same with the tape. If you wathced video about scalping you should understand this.
I watch tape and levelII only than i NEED.
In addition about LVL II. It is repeat same patterns everyday all the 8 years i am watching it.
Find those patterns and share what you have. They will be shown ALL OF THEM throught a one single day.
Just observe both offers and bids together.
The reality is YOU CANT READ WITHOUT UPGRADED TAPE ANYMORE.
Things have changed in the way that usual tape 65% times does not makes sense at all.
Yes i do have. Than you feel BIASED about some sort of movement start to say to yourself the opposite.
For example you see SHORT. Start to say to yourself I SEE LONG.
Than inner part of you will resist "But there a downtrend bla bla bla bla".
The inner part of you will start to produce arguments why it is short.
You need to overcome the resistance and start to say once again I SEE LONG.
You will feel tension. This is your brain start to proceed new information.
Once again no metter how difficult say I SEE LONG. At the particular moment you will feel HESITATION about short.
Once again say I SEE LONG I NEED TO SEE LONG. And soon you will realize you LONG BIASED.
The same thing you can do with shorts. But i do prefer to be NOT BIASED. SO i am saying THERE IS NO DIRECTIONS I SEE.
THis is a drill you need to do every day. Once you will do you will see how your perception changing from LONG BIAS to SHORT BIAS with the same chart and the same chart patterns
@bloom, I started looking into orderflow few weeks back. My intention is not to use it for scalping but enhance my understanding of auction process and see if it can complement my current strategies. Here is a look at Aug 18 HOD ( high of the day ) using orderflow and tradeflow. I want to see if this can convey the things you are looking with orderflow (start and end of an aggression , absorption , exhaustion etc ). Tape speed is captured in the time taken to complete the bar. Appreciate your comments.
First about scalping ))
I do not trade scalping in the common way. I am using trade entering and trade management which scalping is using, but than i do a trade longer than scalping time frame. Usual 3-6 points. Sometimes 10-15 points. I can enter with a scalp trade entry and than stay all day in a position.
Comments about situation at your chart and how do i see it.
I am reading order flow within a context, which created by different traders groups dependent on a TRADE ROUTINE STAGE they are.
Different trade stages contain different TRADE MANAGEMENT actions.
You do not need to place a stop loss order than you are exiting from a position.
So. The stage grouping tells me what traders are doing and which orders they are using.
This creates a context for me to watch order flow.
This is a huge topic and not enough to cover in 1 answer. But the structure of every movement consist few elements and i will discover this example you gave me:
1) Main goal - trigger the stops of sellers above top of the day
2) Tactical goal - convince traders that market moving higher, so they will create the actions we need.
To do this we need to take IMPORTANT prices and HOLD ABOVE them.
First we need to take 2426.50 Open. Than we need to hold above 2426.50 at 2430-2431.
Than we need to take TOP of the day and than to hold above the top. And so on.
3) OPERATIONAL GOALS and current OPERATIONAL ACTIONS - this is what creates current order flow TYPES.
Agression, absorption, exhaustion and so on. Those FLOW TYPES on their own not very usefull in my opinion and experience i have had .
The situation you showed - after sellers stop loss orders were triggered market stops to evolve.
I do think this way because of ENERGY of farther downside movement. Too tight swings. No convictions behind - just fixing
Thank you bloom. I was long from 22 but for other reasons. Market internals (Spreads, TICK ,VIX) had a huge divergence and the retest of the lows were not supported from internals.
I can see the failed attempt from sellers to push the price lower, as the large sell orders were absorbed. I have to start identifying the context / patterns from orderflow as you mentioned, as I do with price/volume action and market internals today.
How do you qualify and confirm a failed attempt by sellers to push the price lower from order flow , for e.g 2420 on friday ?