Welcome to NexusFi: the best trading community on the planet, with over 150,000 members Sign Up Now for Free
Genuine reviews from real traders, not fake reviews from stealth vendors
Quality education from leading professional traders
We are a friendly, helpful, and positive community
We do not tolerate rude behavior, trolling, or vendors advertising in posts
We are here to help, just let us know what you need
You'll need to register in order to view the content of the threads and start contributing to our community. It's free for basic access, or support us by becoming an Elite Member -- see if you qualify for a discount below.
-- Big Mike, Site Administrator
(If you already have an account, login at the top of the page)
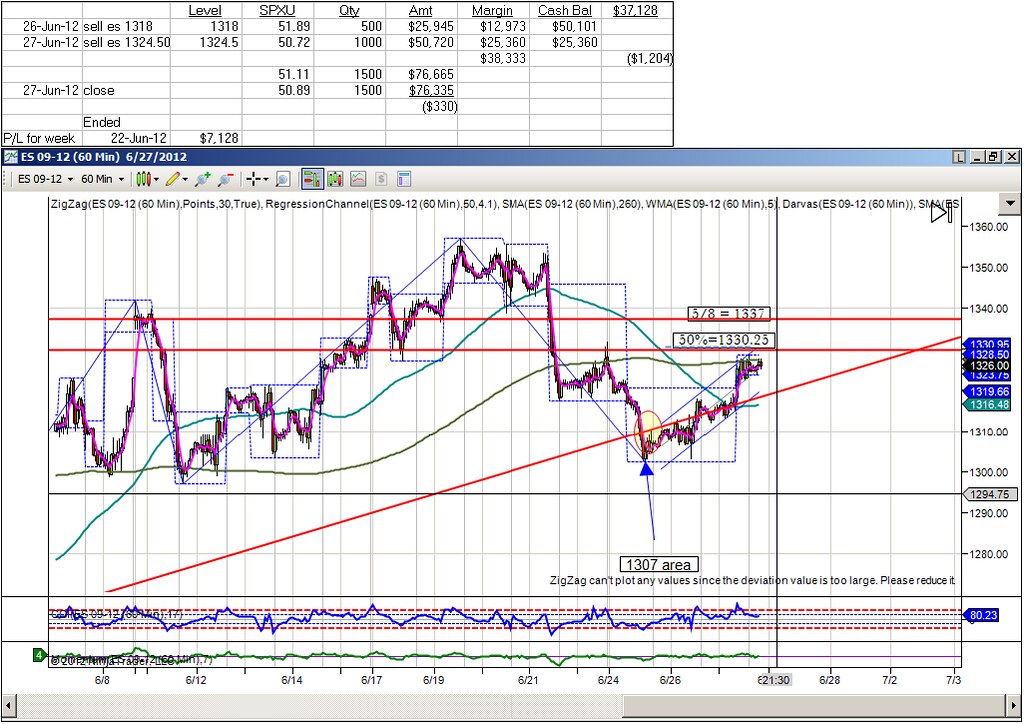
Yes still holding. Yes is a paper exercise for a friend inspired by Spoo-analysis to show that very good money can be made by trading ETFs for a person who is working. The idea is you review the charts over the weekend and draw up the gameplan for the week.
So the first set of trades was for the week finishing on 22 June. In ES terms
Bot opening Monday
Sold and reversed (CAR) at 1353 (high 1357)
Close on Thursday 1319 (low 1317).
(Since I'm using SPUX the trades are reversed - Sell at open....)
This week the gameplan is that will be a bounce up to the green line (roughly) and then a fall which could eventually take us below the 1252 low, so might hold after Friday.
So why aren't I stopping out? Well the gameplan is a rough roadmap.
The bounce is higher but I bot higher and I'm only -$330 and I have +$7,128 from last week.
With ETFs you can ease in and give it more room.
It holding below the SMA you can see (green)
and more importantly ES still below 50% and 5/8
----
If it pushes through 5/8 on the close I may have to consider that I was wrong on this trade.
Good tradin to you and thanks for the pivots - the R2 was close today
Nothing posted here is trading advice. Everything posted is educational information only. Futures and other trading involve the risk of loss. yada, yada, yada....
Soccer fans are only two games away from the Euro 2012 finals. Portugal and Spain play today while Italy will face the Germans on Thursday. The winners will play to claim the title of the Best in Europe.
Its hard not to draw ironic parallels, as Thursday also marks the beginning of the EU summit to settle the economic score. The lay-up analogy was earlier in the week, when the best beat the worst as Germany topped Greece 4-2 to advance to the semi-finals.
If financial health translates to future soccer success, Germany should trounce Italy while Portugal and Spain will play an uninspired, poorly executed match that ends in a 0-0 tie.
While the US doesnt compete in the Euro Soccer (truth be told, wed get our butts kicked), we are the big player in the European financial game. In fact, the man of the match should be Ben Bernanke.
Thats right, because even though the US isnt in this game, Ben Bernanke is the uber defender, stopper and goalie for all of Europes woes. Not only is the U.S. single largest source of money to the International Monetary Fund, we are the lender of last resort with continued dollar injections to the Eurozone.
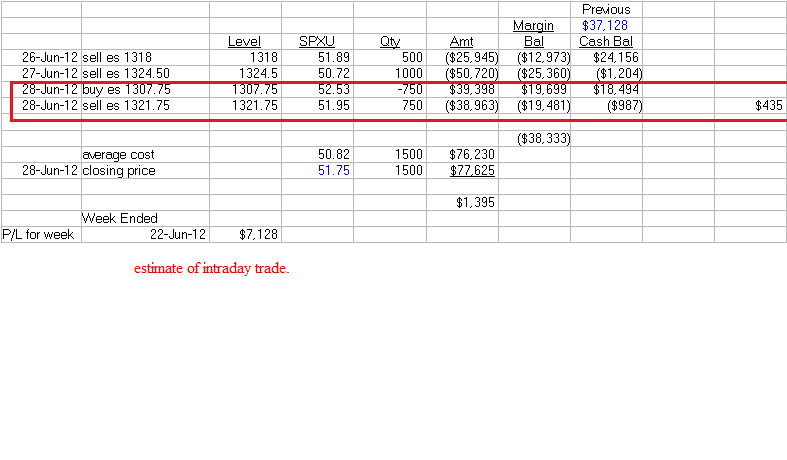
I looked at intraday trading of 1/2 the SPXU position, that is selling 750 shares this morning and rebuying near the close. Doesn't seem to be worth it, perhaps $400-$500 or so.
Nothing posted here is trading advice. Everything posted is educational information only. Futures and other trading involve the risk of loss. yada, yada, yada....
Earlier, in SPoo-analysis thread, I posted that with the creation of 5 trillion dollars in 5 years, pumped into the banks and practically none of it reaching the economy, that there is a vested interest on the part of the govt manipulation of the market.(
Good the see you too - red letter et al - congrats!
Yes you only posted chart with arrows -you did not post resistance - or even possible resistance levels.
I was responding to your post that you see action like today worrying. Your post immediately …
)
There are 3 publically declared tools: 1. The plunge protection act, 2. the Fed, 3. the little known and little publized market support act. It is the later that is the most important to the Spoo-analysis thread.
This vitually unkown act give the president the power to use federal money to purchase stocks and drive up the market [bold]at ANY TIME he chooses[/bold]. This is the key. If YOU were the president in an election year getting into the election session, just before the national holiday (4 July) and your landmark legislation is cleared by the courts (Obamacare), when is the most politically advantageous day to manipulate the markets - with your 100% legal right to do so?
How about the day after "your" health care legislation is passed?
Ask yourself, "Do you think it is "co-incidence" that the rally is today?"
It is the day the voters are asking themselves - is this good or bad?
And what happens? The market soars? Most people haven't a clue about the markets. IF the weekend newspapers have headlines like:
"Market soars on announcement of Obama's heatlh care legislation!"
It helps him in discussions about health care - over the July 4 barbeque parties.
This post is [bold]not[/bold] to sidetrack the thread into - healthcare, political rambling, and vague and incorrect abstractions about the fed -who it really is and what its real function is, nor is this market manipulated and by whom? (For myself only an person using massive cognitive dissonance and incredibly naive could believe it is not manipulated.)
This post remind those who trade the ES - it is a manipulated market.
To forget that is to throw out the most important factor in the estimation of the ES movements, IMO.
When is the best day to manipulte? either when is it polically advantageous (to Fed, US Govt etc) OR when it is least expected.
Nothing posted here is trading advice. Everything posted is educational information only. Futures and other trading involve the risk of loss. yada, yada, yada....
The above post is not an invitation to have people post in my trading journal any-thing off topic.
This journal is only for those interested in Estimation trading.
Please do not post your thoughts on manipultion or politics or "the news" etc.
I welcome those interested in this type of trading to PM me, or email me.
Fridays stock indices all closed markedly higher, which came after huge higher gap opens. What happened in between the higher gap opens and the close was nothing. The markets were dead until the closing bell. Only then was there life when the markets went even higher on a short covering explosion.
Stocks opened around 2% gap higher this morning after the late-night headlines from Europe made many think that the tooth-fairy and Santa are real once again. S&P 500 e-mini futures saw some selling into the open but then stabilized amid a very narrow range for much of the rest of the day - leaking higher on low volume-driven short-covering. The news from Germany of ESM ratification was greeted with absolutely no price movement as an indication of just how insane things are but the need to drive stocks up in the last few minutes was crazy. Into the close, volume exploded as ES rose 10pts in minutes from absolutely nowhere. Average trade size was very heavy during this period and delta skewed notably to block selling into the ramp though it is never that obvious. ES closed above its 50DMA back to its highest since 5/8.
The Window-Dressing Roadmap
It would appear that the No 'New' QE from the FOMC on 6/20 left a lot of all-important funds long-and-very-wrong. Today's rampfest miraculously lifted (window-dressing) Energy and Financials (two of the MOST sensitive sectors to QE) back to perfectly unchanged from the exact time of the FOMC announcement. Notably, since that exact time 'safe' sectors of Staples, Healthcare, and Utilities have outperformed as Tech, Materials, and Discretionary are underperforming (though all did their very best to end the month up (especially relative to the FOMC news moment)... fascinating eh?
While stocks exuded every bit of total insanity, Treasuries ended the week lower in yield across the whole complex (leaving Gold, the Long Bond, and the USD all almost perfectly +2.8% YTD). WTI is down 14.5% YTD to close Q2 thanks to a huge VW-like 9% squeeze higher today (that acounted in correlated risk terms for around half of equity's performance) up to around $85. Equity and HY credit have recoupled but HYG is the most expensive relative to its fair-value in over a month. The USD plunged on EUR strength (and AUD carry trades) to end the week -0.66% but Gold and Silver more than doubled those implied gains ending the week +1.8%. VIX tested below 17% late on but ended above it (down 2.6 vols) closing at 6/20 closing levels. The main takeaway is that most risk assets recovered to last week's highs but stocks turned the amplifier of insanity to 11 and pushed back to near two-month highs not to be outdone into quarter-end (wink wink).