Welcome to NexusFi: the best trading community on the planet, with over 150,000 members Sign Up Now for Free
Genuine reviews from real traders, not fake reviews from stealth vendors
Quality education from leading professional traders
We are a friendly, helpful, and positive community
We do not tolerate rude behavior, trolling, or vendors advertising in posts
We are here to help, just let us know what you need
You'll need to register in order to view the content of the threads and start contributing to our community. It's free for basic access, or support us by becoming an Elite Member -- see if you qualify for a discount below.
-- Big Mike, Site Administrator
(If you already have an account, login at the top of the page)
NOTE - This is the last prep for 2 weeks. I will be taking my father on vacation for the next few weeks.
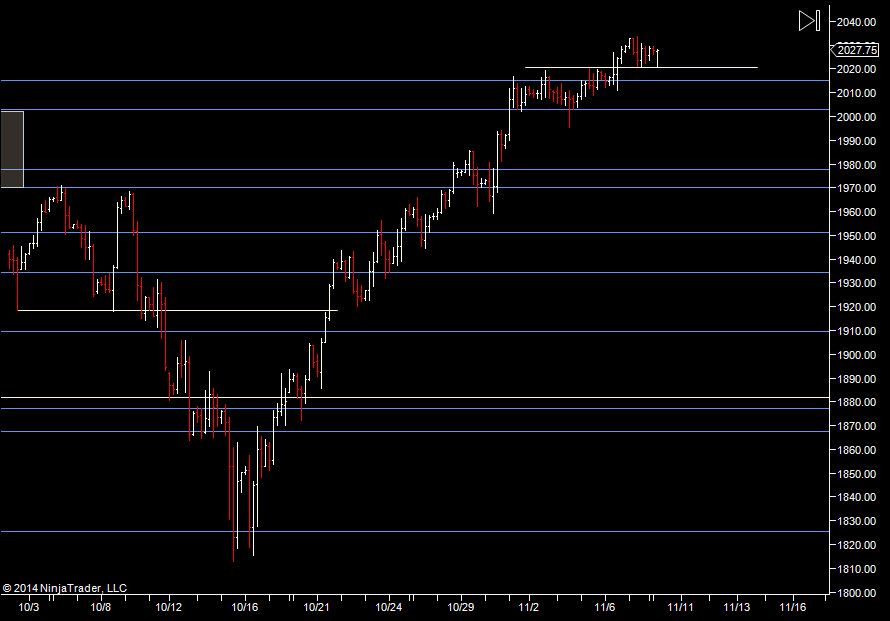
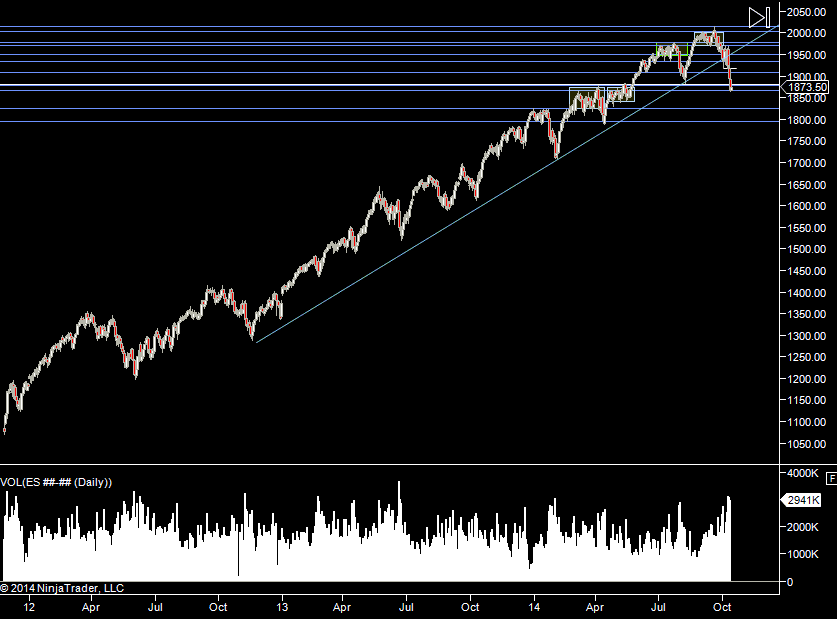
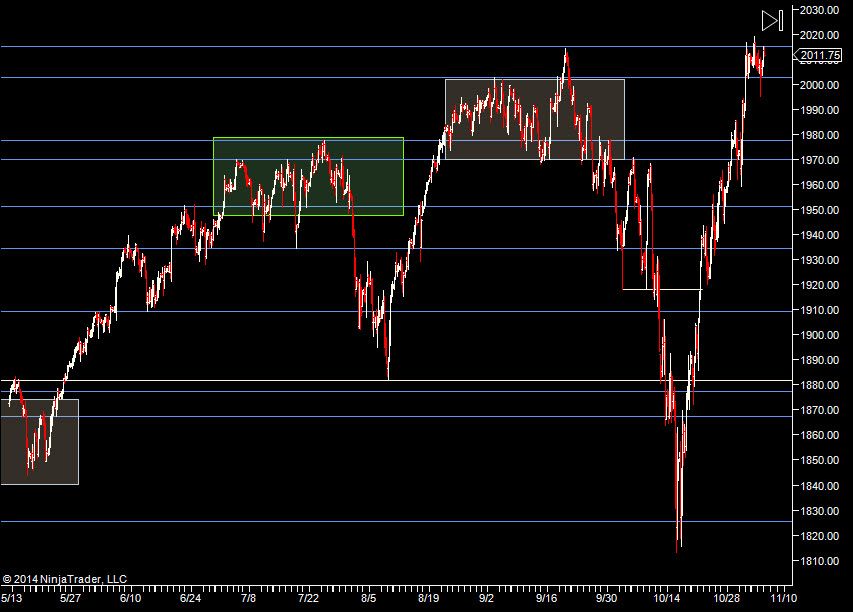
It's worth stepping back and looking at the big picture. This is the first time since July 2010 that we have breached a major swing low. This isn't a huge pullback in the grand scheme of things but we are doing something we haven't done for a number of years.
With QE ending this month, we could see an adjustment to new price levels and then see a somewhat more rational market. Right now, it's swinging wildly with high volume and low liquidity.
The market has an inherent long bias. Many types of investment vehicle can only buy (e.g. mutual funds) or stay flat. They are not allowed to short the market.
So I see this as a buying opportunity and I'm scaling into longer term positions. I don't know how low it will go but I do believe it'll start going up again because of the built in long bias.
Yesterday we had
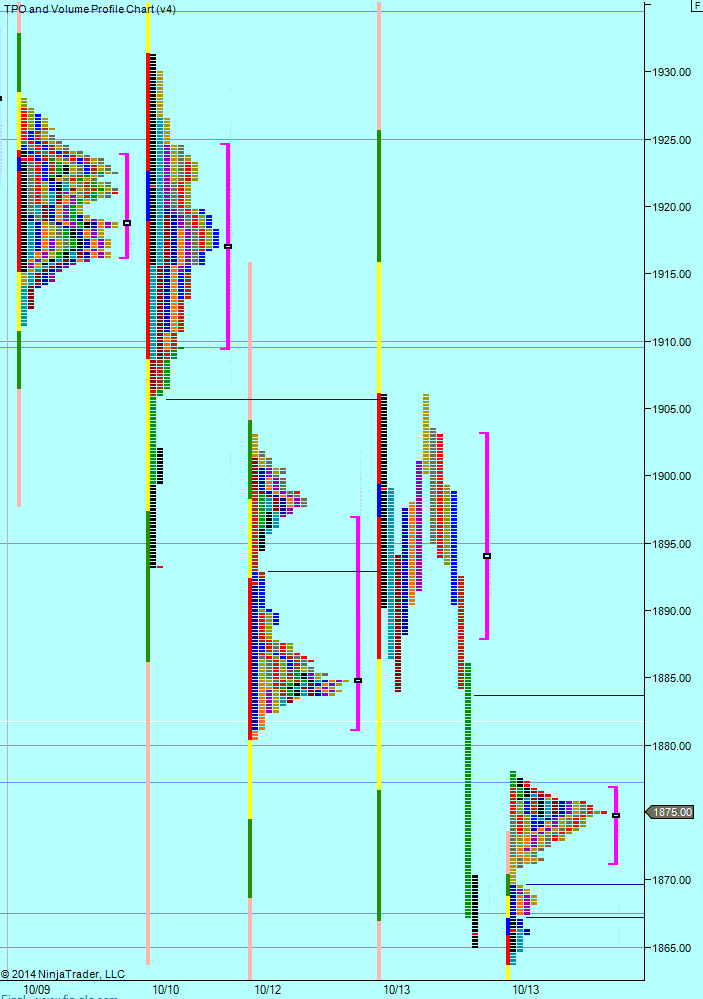
We dipped through the 67.50 getting down to 65. We have popped above it and today I'm looking to see if we can hold that but expecting them to run and break it.
Yesterday we had
We got up to 1906 twice, then rolled over. So the same again today... watching the breakdown point 1884 and the VAL at 1888. We also have a longer term level at 1877.25 which was irrelevant in yesterdays sell of but has provided resistance in the Globex session as at this point (4:20am EST).
So look for an upside test and for sellers to come in. I'll need a lot of confirmation to go long!
Weekly Numbers
Range - 1893.25 -> 1971
Value - not much use on an elongated week like last week
S1 1868 R1 1945.75
Daily Numbers
Range - 1865 -> 1906
Value - 1888 -> 1903
Globex - 1863.75 -> 1878
Settlement - 1865.50
Today: 1884
Long Term - 2003, 1977.75, 1970.25, 1951.25, 1934.50, 1909.50, 1877.25, 1867.50
If you have any questions about the products or services provided, please send me a Private Message or use the futures.io " Ask Me Anything" thread
However, in the last years of my fathers life, he and I took a 'vacation' trip.
Now that he is not with me any longer, those are some of the best memories of our friendship.
Have a great time and savor the moments.
Rejoice in the Thunderstorms of Life . . .
Knowing it's not about Clouds or Wind. . .
But Learning to Dance in the Rain ! ! !
Back of vacation and wondering what all these squiggly lines on a chart mean. First few days back for me is just really getting back into the swing of things with no pressure to trade.
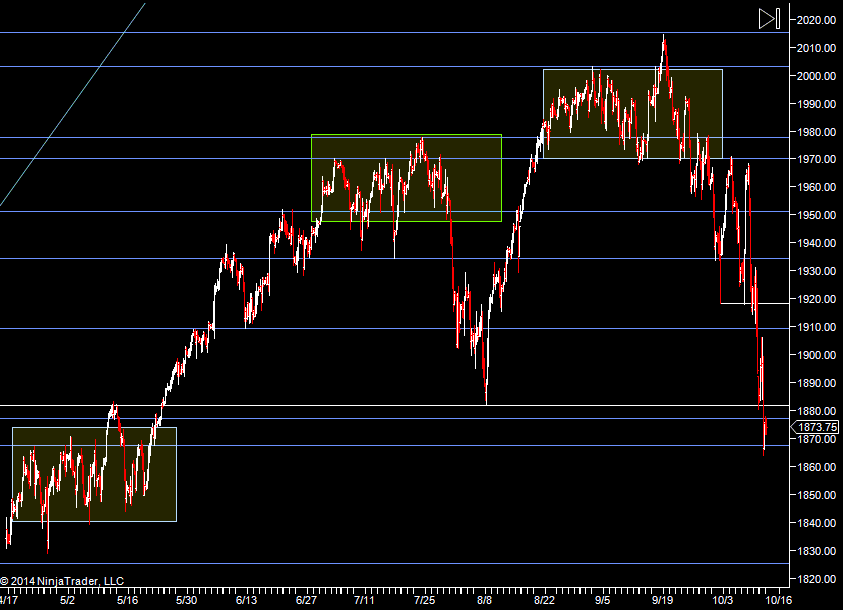
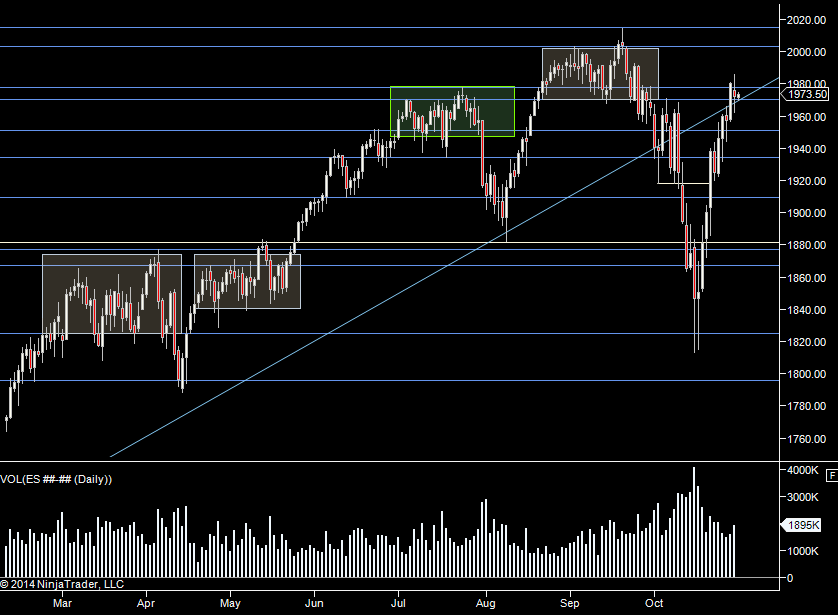
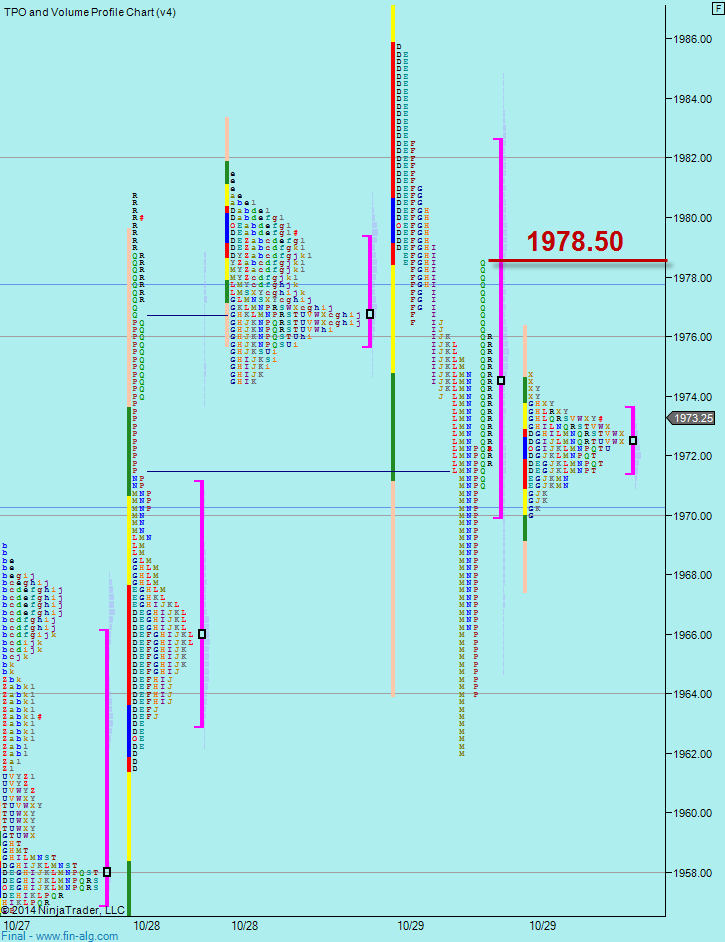
Seems like a lot of fun was had in my abscence. A huge volume day signaled the end of the down move and we are now looking like the tops are at risk again. We have broken above the 77.75 level and taken a pause there. I don't have any more levels between here and 2003. So today looking to see if we can properly pop thru 77.75 and then it looks like it could be a slow grind to 2003 if we consider all the chop to our left (the dreaded white box).
We pulled back yesterday to 78.50 and so that is worth watching today. We do need to 'escape' the Tuesday/Wednesday range and if 78.50 holds, I wouldn't expect too much more than a trip to yesterdays pit session low.
So far yesterdays value low has held in the Globex session but this is a very early prep. That low is also close to the 70.25 level.
So today I'm looking at 78.50 and yesterdays levels. Expecting grind if we move up.
Not much more to say until I get back into the groove as I've not been participating through all of this up move and I have no 'feel' for how those days have been playing out.
Weekly Numbers
Range - 1944.50->1985.75
Value - 1958.50 -> 1981
Daily Numbers
Range - 1962 -> 1985.75
Value - 1970 -> 1982.50
Globex - 1970-> 1974.75
Settlement - 1972.25
Today: 1978.50
Long Term - 2003, 1977.75, 1970.25, 1951.25, 1934.50, 1909.50, 1877.25, 1867.50
If you have any questions about the products or services provided, please send me a Private Message or use the futures.io " Ask Me Anything" thread
Last day of the month this month. With the lack of overall liquidity, I don't think we can reliably make any presumptions based on that this month.
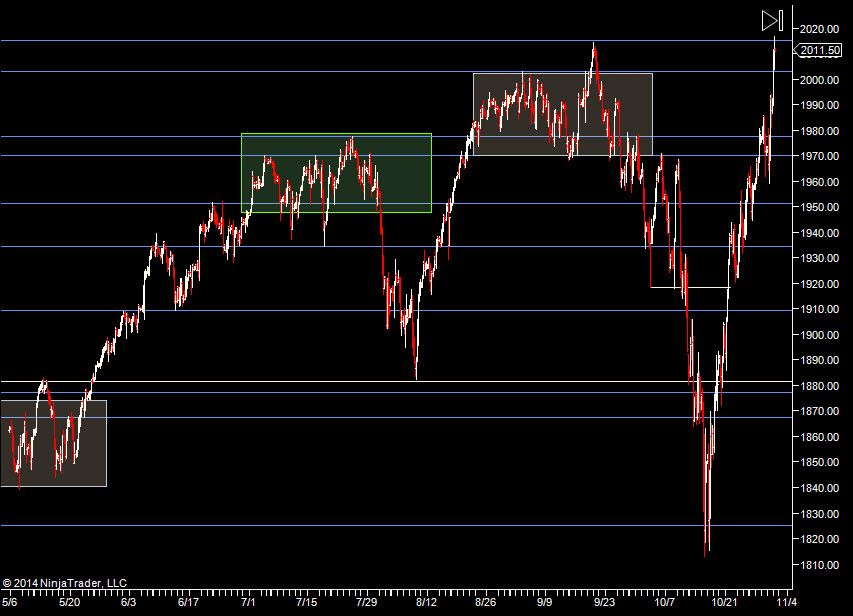
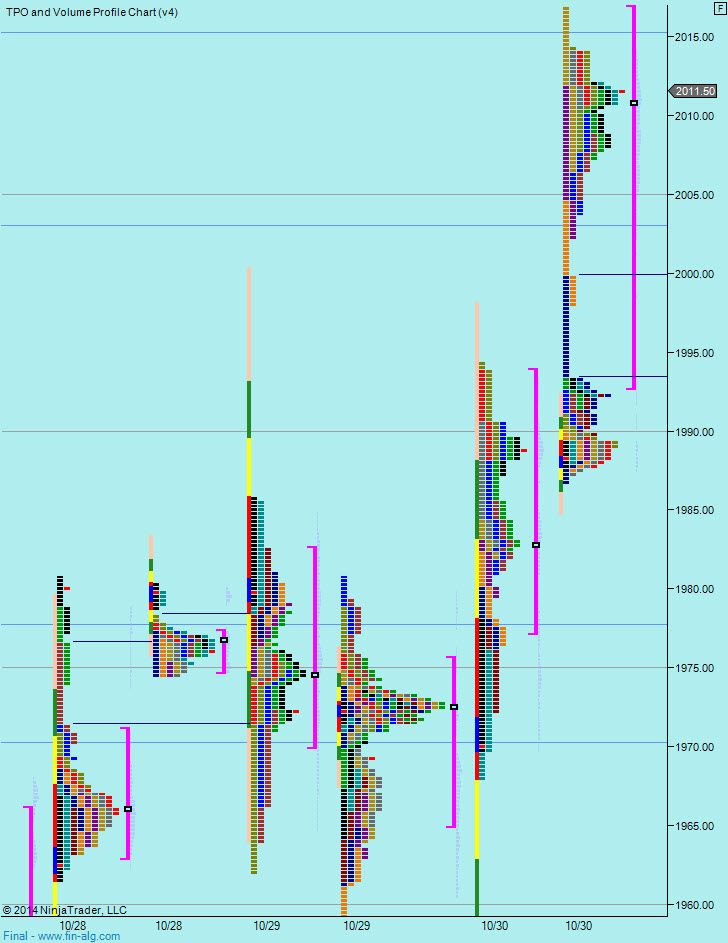
Wow.... So that's the high gone. So obvious question to answer today is "can we keep it". If so - a push up and a retest of 2015.25 would be an interesting long but we'd need more of a push up first. Obviously if it sells off, there should be a lot of people on board, looking at the double top and shorting it.
Given the move, there's not much to play off. If we do move down then yesterdays high or value high will be of interest as will 2003.
Yesterday we had a very erratic market until 10:15. The period from 9:30->10:15 was very tough to trade and so today I'll be looking to see if that part of the day is 'erratic' and look to play when it slows down. I don't expect levels to hold in the early part of the day or rather I don't expect them to hold with the sort of accuracy we usually see as it's so slippy.
Once we get to 10:15, I'll be looking at the reaction from the levels for bias and then see if I can play off the swing sizes or volume profile.
There is obviously more opportunity on the table because of the bigger swing sizes but the risk is greater too. I personally don't like this sort of market. As the next few weeks unfold, I'll either be adjusting my techniques or moving to a more liquid market.
Weekly Numbers Range - 1944.50->2016.75
Value - 1952.25 -> 1980.25
Daily Numbers
Range - 1968 -> 1994.25
Value - 1977.25 -> 1993.75
Globex - 1970-> 2016.75
Settlement - 1988.50
Long Term - 2015.25, 2003, 1977.75, 1970.25, 1951.25, 1934.50, 1909.50, 1877.25, 1867.50
If you have any questions about the products or services provided, please send me a Private Message or use the futures.io " Ask Me Anything" thread
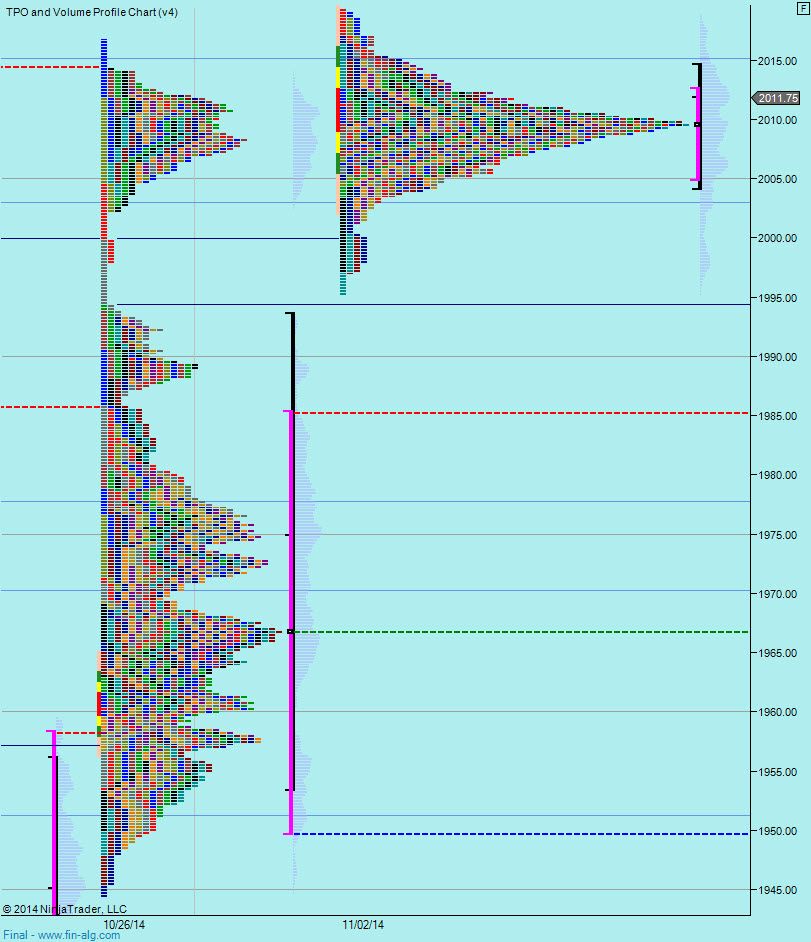
We took a poke through the highs in the globex session on Friday and in the day session has the smallest range day for a while, just rotating around.
On Friday we had
The 2003 level does seem to be holding right now and I'll be using that as a line in the sand and expecting sellers to come in if it breaks.
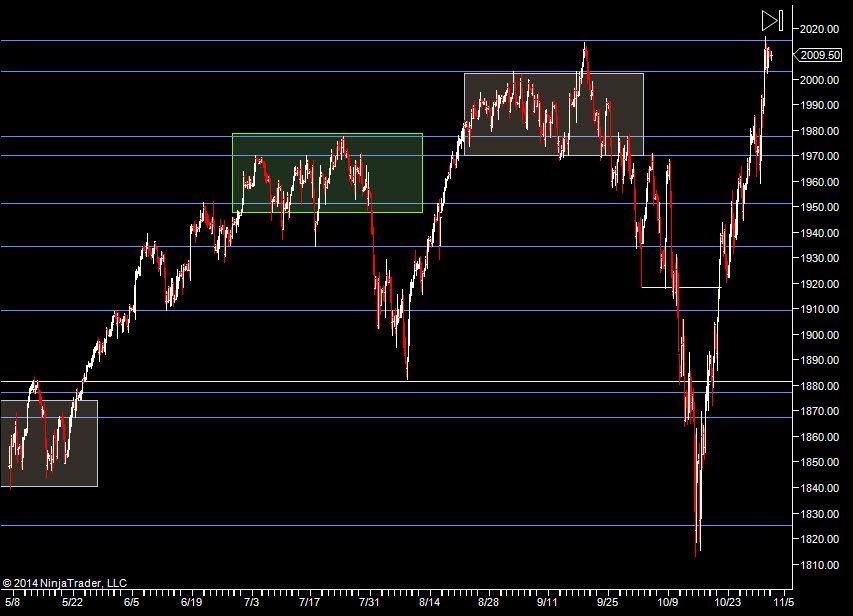
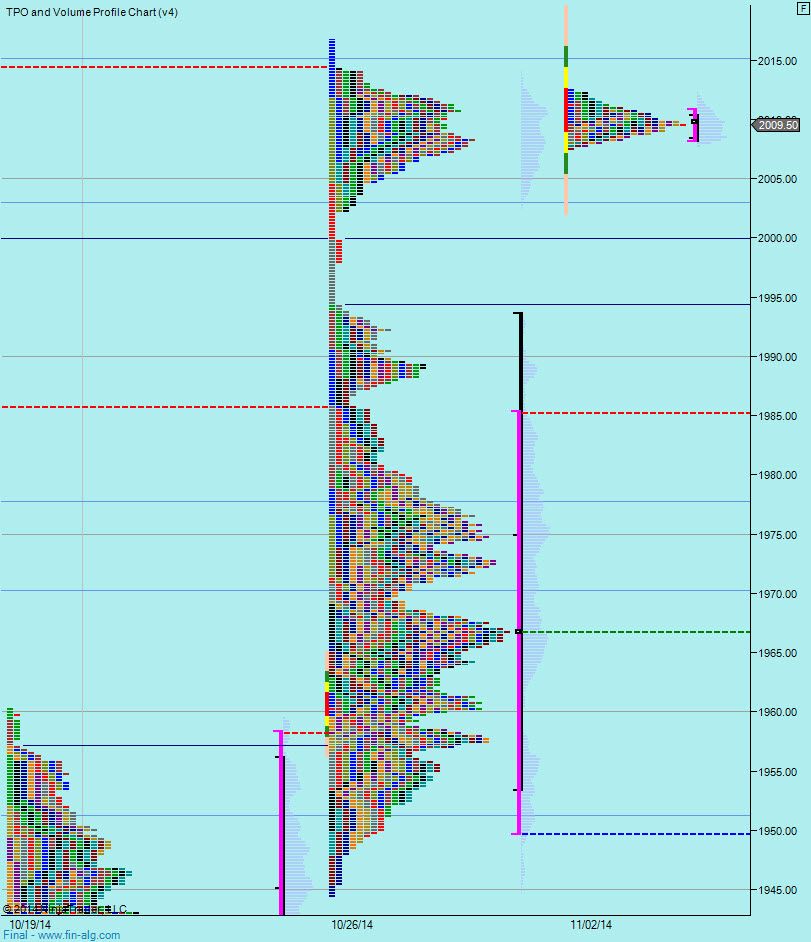
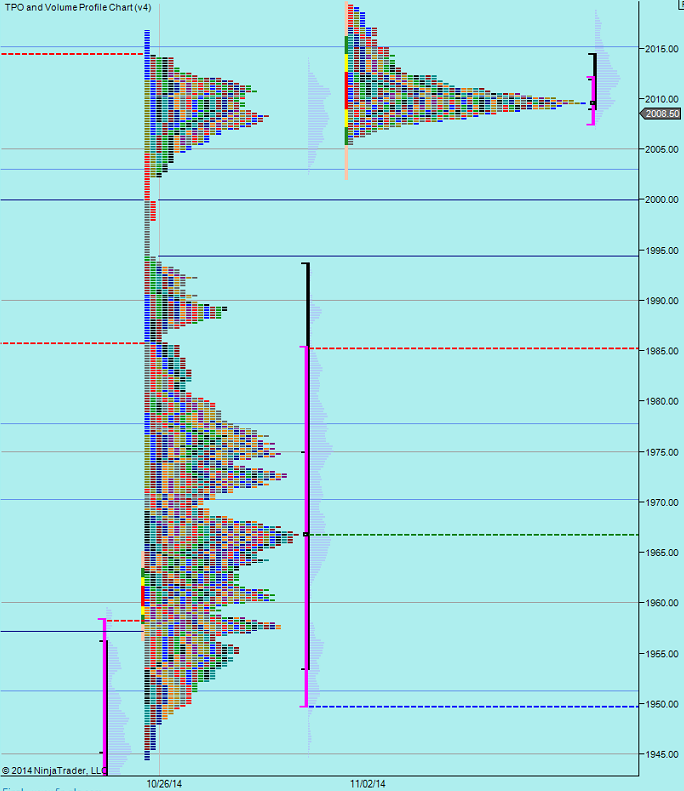
The weekly profile shows very thin trading below 2003 down to 1994.50. On the top chart above, that area was a chop zone, so that implies churn below 2003 but more recent action shows it shot straight through that area, so I'll be looking for more recent history to repeat itself.
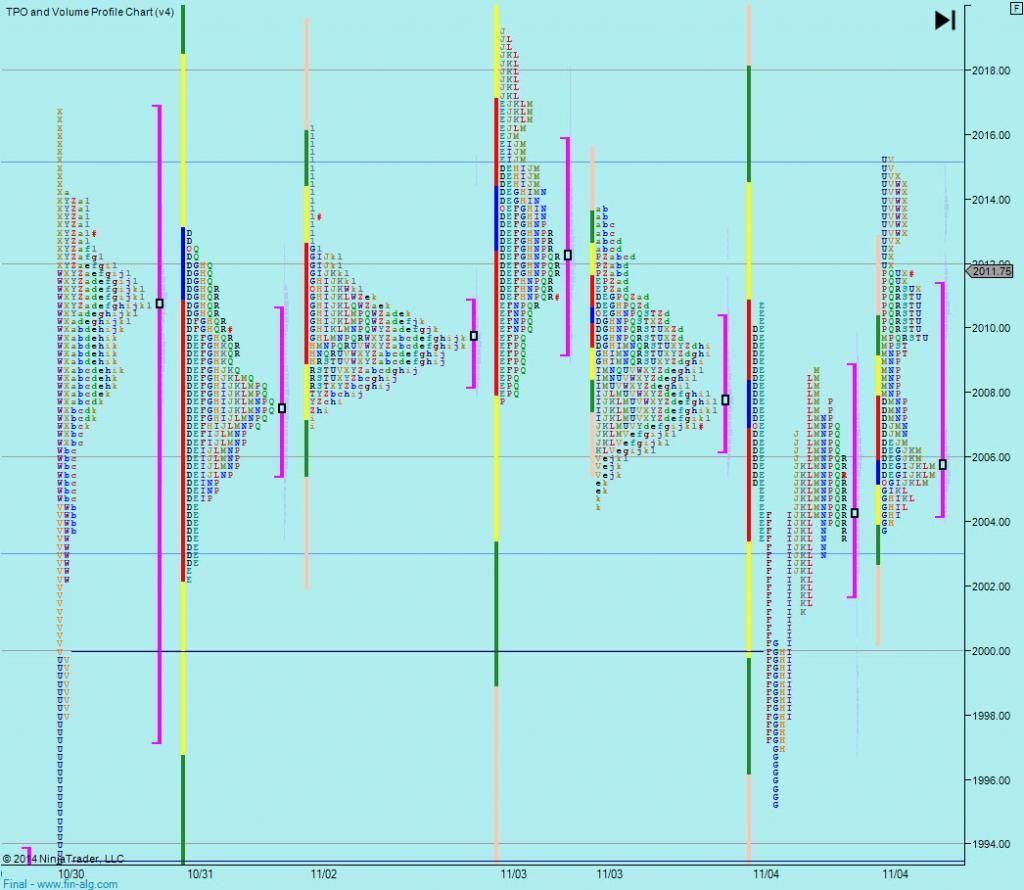
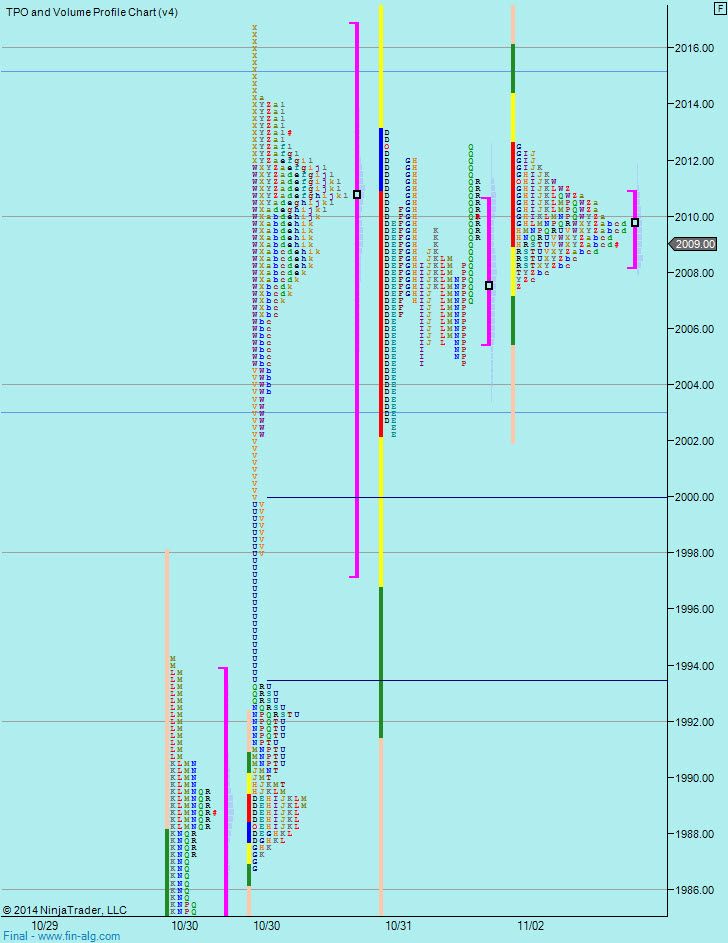
This image better shows the big move up in the Globex session on Friday. We did see 2003 holding (well 2002.25) and that was confirmed in the pit session. The current Globex session (as at 5:25AM EST) is very narrow and the volume is relatively light too for the time of day. Whilst it would be good to see 2003 hold again for upside, we are in danger of getting into narrow chop which would be the complete opposite of the huge range days we have had of late, so I think we have to be wary of the market switching gears at these levels.
Of course it could just rally up to 2030 today so it's just a possibility to be aware of now we are at the highs.
So if 2003 holds, I'll stalk longs, if we pop up through 2015 and pull back to it, same thing. If 2003 breaks or 2015 holds as resistance, I'll look for shorts. In between those prices, I think we need to exercise caution. Fridays value area is pretty narrow and so trades off that area are a possibility, they might not yield much.
Weekly Numbers
Range - 1944.50->2016.75
Value - 1949.50 -> 1983
R1 - 2037.25, S1 1965
So no great shock that we had a fairly narrow day. We did pop up and make a new high but those pops up didn't get anywhere. We settled 2 ticks below Fridays settlement.
In effect we go into today in basically the same position as yesterday...
As per yesterday
11.5 points range yesterday. We can see the afternoon was more directional once sellers finally came in. We are now back in between the 2003 & 2015.50.
As per yesterday
The main difference today is that prior day value area is a little more significant and more worth playing.
Weekly Numbers
Range - 1944.50->2016.75
Value - 1949.50 -> 1983
R1 - 2037.25, S1 1965
Still probing around the 2003-2015.25 range. Obviously building energy/positions in this range for the eventual break out. With something like this, I look for the range to hold (till it doesn't ) and when it breaks, look for the range extreme to hold for a continuation away from the range.
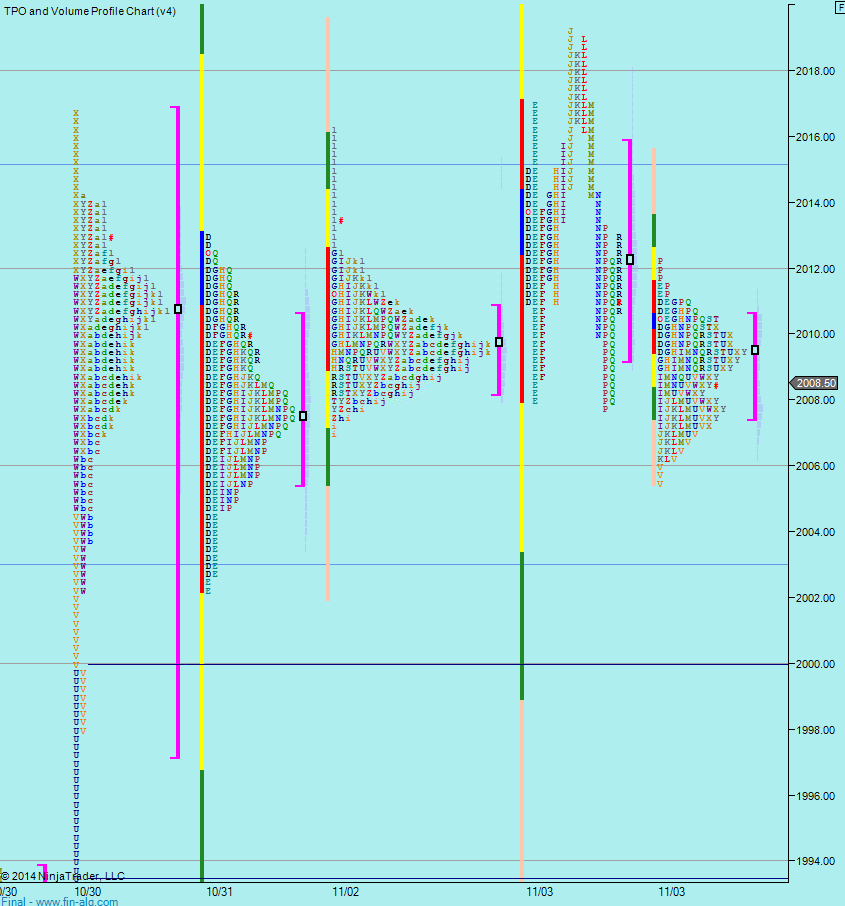
The weekly profile shows very even distribution around the Point of Control for the week (2009.50) . That makes 2009.50 probably the worst place to take a trade.
I don't see much of a pattern in terms of intraday support levels based on prior high/low/value areas. I'm watching them as always but not expecting much. We have hit the high extreme in the globex, so it may be that we now traverse down to 2003 but that's fairly tenuous.
I won't be in a hurry to trade today. It's choppy and that's generally a tough trade.
And best wishes to Ian at Jigsaw today who had a bump on the head on Sunday and ended up in the operating theater last night removing a blood clot that was squishing his brain. May you make a speedy recovery, my friend!
Weekly Numbers
Range - 1995.25 -> 2019.25
Value - 2005.25 -> 2012.50
R1 - 2037.25, S1 1965
An early prep today, so Globex action could change the picture.
As per yesterday
Not much more to add other than we seem to be trading more at the top of the range than the bottom.
Intraday though, the market is acting much more like the ES we know and love. It's not as erratic as it has been in since mid-September. Of course, that could just be because we are in a relatively tight range. We had good liquidity for a lot of yesterday with periods where depth was back in the 1000's per level. We also got a decent amount of stacking and that in turns means we had levels to lean on and time to make a decision.
Levels to lean on were also holding to the tick, not like the 5-6 ticks slip throughs we saw when liquidity dropped.
So it remains to be seen if this will continue when we break out but we can hope.
The weekly profile shows how the range is shifting up from both a time and volume perspective. Classic profile analysis tells us that means it's more likely to go up. For me, it makes it trickier to guage where a re-test will be if we move up and come back down.
Yesterday we had
And yesterday broke the "non-pattern" by probing down to Tuesdays value high before buyers came in. So whilst it wasn't what I was expecting, it was certainly nice to see as it's more in line with the personality of the ES.
The range yesterday was just under 12 ticks. We are at the top of a distribution that has lasted 3 days and so there is energy built up for a break. So today, looking for a signs of a break. By the time the pit session opens that may have happened aready (either side). If it does break in the Globex, then looking to see if that can be carried through when the real volume comes in at 9:30.
If we do get a break, then I'll go with the move and if not, I'll be biased short. Also watching yesterdays intraday levels for a hold if I the overall range holds - playing the range with a view to get to the other side but being wary of those intraday levels. If an intraday level holds, then I think the chance of a break increases significantly.
Weekly Numbers
Range - 1995.25 -> 2020.50
Value - 2007 -> 2016.50
R1 - 2037.25, S1 1965
We have now pushed up away from the range early in the week. In terms of upside, it would be nice to see the market re-test the top of the range and reject it. That would give us higher probability longs. If we continue straight up, I will participate but I see those as lower probability trades till we have a test of some sort.
Of course, we could just sell off and again, the range high is key. Any short into the range high risks at least an initial bounce when we get there.
So where is the range high? Looking at the profile for the week, I'd say around 2018 area is the top of the distribution. So looking for 2018-2010 as a line in the sand for both sides.
That 2018-2019 area does look a long way down, so we also have yesterdays value high at 2025 and the late pullback from yesterday at 2022.25.
So today will play upside but feel better about it if there's a downside test. We are 100% long right now in the Globex session and shorts will be OK down to 2018-2019. If we move down off the open we have to be wary of those test areas because longs are used to getting their own way and shorts are used to getting trampled right now.
Weekly Numbers
Range - 1995.25 -> 2032.75
Value - 2006 -> 2017.75
R1 - 2037.25, S1 1965
Daily Numbers
Range - 2010.75 -> 2028.50
Value - 2016.50 -> 2025
Globex - 2027 -> 2032.75
Settlement - 2028
Today - 2018-2019
Long Term - 2015.25, 2003, 1977.75, 1970.25, 1951.25, 1934.50, 1909.50, 1877.25, 1867.50
If you have any questions about the products or services provided, please send me a Private Message or use the futures.io " Ask Me Anything" thread
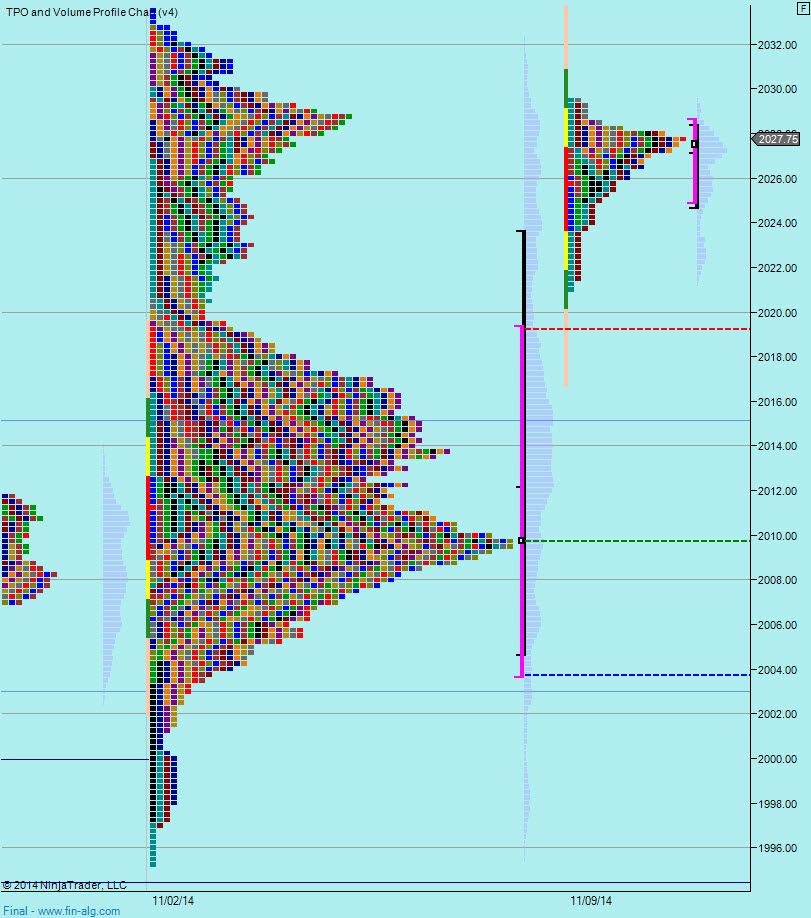
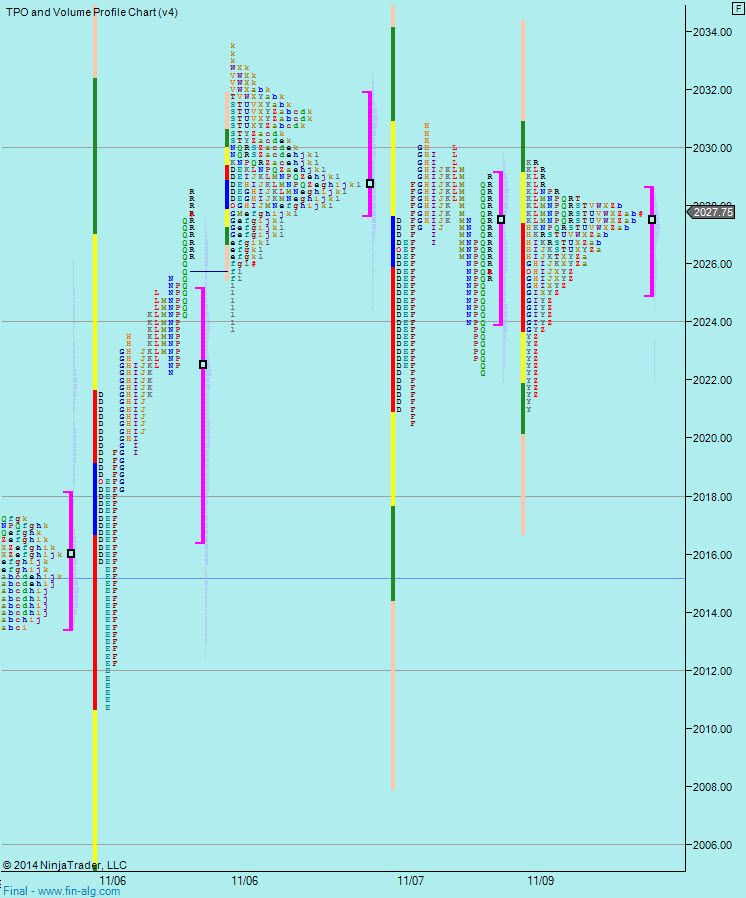
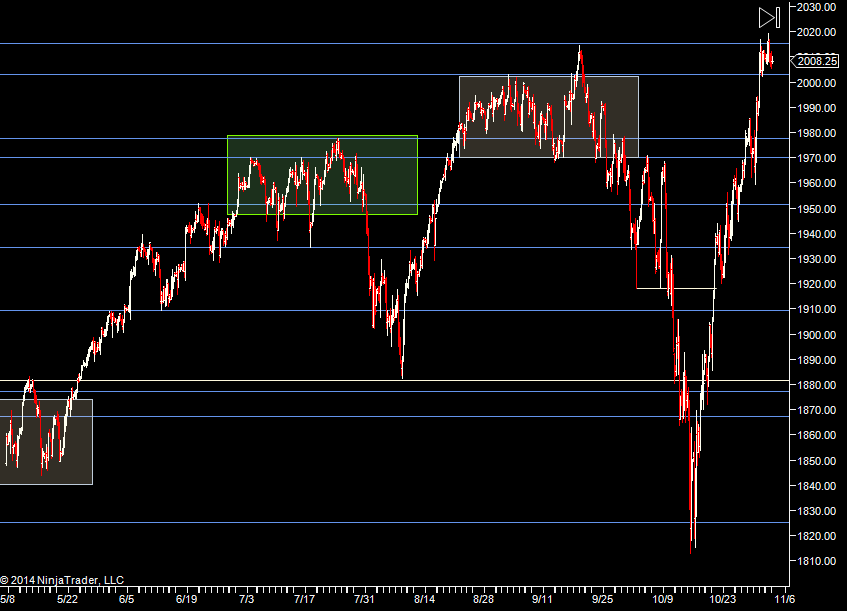
looking at the above zoomed in view, it does look like we've tested the top of the old range. So now looking to see if we can hold this for more upside today. So looking at 2020.50-2020.75 to hold.
Value wise - we can see the larger lower distribution from last week. We really do not want to start eating through that for long bias. I think last weeks value area is a good line in the sand for that but I'll give it a point below that before I start thinking we are back to the range and looking at 2005.
The globex session is so far basically moving around Fridays range, so just like last week, we need to be wary of starting out in a tight range. Wherever we open relative to Friday, I think tests of the highs/lows (or value area high/low) are going to be the best pointers early on.
So looking at a long bias needing 2020.50-2020.75 to hold then looking for 2018 to hold if that fails to maintain the long bias. Will take trades off Fridays key levels off the open with a preference for the long side. Switching to shorts below that 2018 level or a bounce off Fridays high/value high.
Weekly Numbers
Range - 1995.25 -> 2033.50
Value - 2003.75 -> 2019.25
R1 - 2041.25, S1 2003


 ) and when it breaks, look for the range extreme to hold for a continuation away from the range.