Welcome to NexusFi: the best trading community on the planet, with over 150,000 members Sign Up Now for Free
Genuine reviews from real traders, not fake reviews from stealth vendors
Quality education from leading professional traders
We are a friendly, helpful, and positive community
We do not tolerate rude behavior, trolling, or vendors advertising in posts
We are here to help, just let us know what you need
You'll need to register in order to view the content of the threads and start contributing to our community. It's free for basic access, or support us by becoming an Elite Member -- see if you qualify for a discount below.
-- Big Mike, Site Administrator
(If you already have an account, login at the top of the page)
If you do not want to use floor pivots, you do not need to do so.
If you want to know, whether they provide an edge, you should design a backtest and find out.
From my personal observations (screen time, not backtested) the folowing meeting points are important for daytrading:
- trend lines and trend channel lines
- highs and lows of the last 10 days
- floor pivots
- VWAP of current day
Other traders watch these levels for orientation. If they are not S/R, they are at least decision points in a way that price can be observed around these levels. Price action can then be interpreted as either bullish or bearish.
*Price bounced off weekly R2(at top)
*Went down to daily R1 and bounced
*Went down to daily pivot and bounced
*Went down to daily S1 and bounced
*Went back up to pivot and bounced
*Went back down to S1 and bounced
One thing I forgot to mention in my earlier post. Fattail touched on it, and maybe Shodson, if he's reading this would like to chime in... certainly the previous day's close is a big line on the chart that has been back tested and forward tested and is a key trading strategy for many many traders.
I prefer that definition. As such they do not provide an edge but act as a sign post. In other words, you need price to hit them before acting just like any moving average act as a sign post.
No it is not but you must realise that you become aware of this after the fact. You could draw a line when price gets there and have the same effect or information. Unless you can act before the fact or these lines can act as real inflexion points this is just information overload.
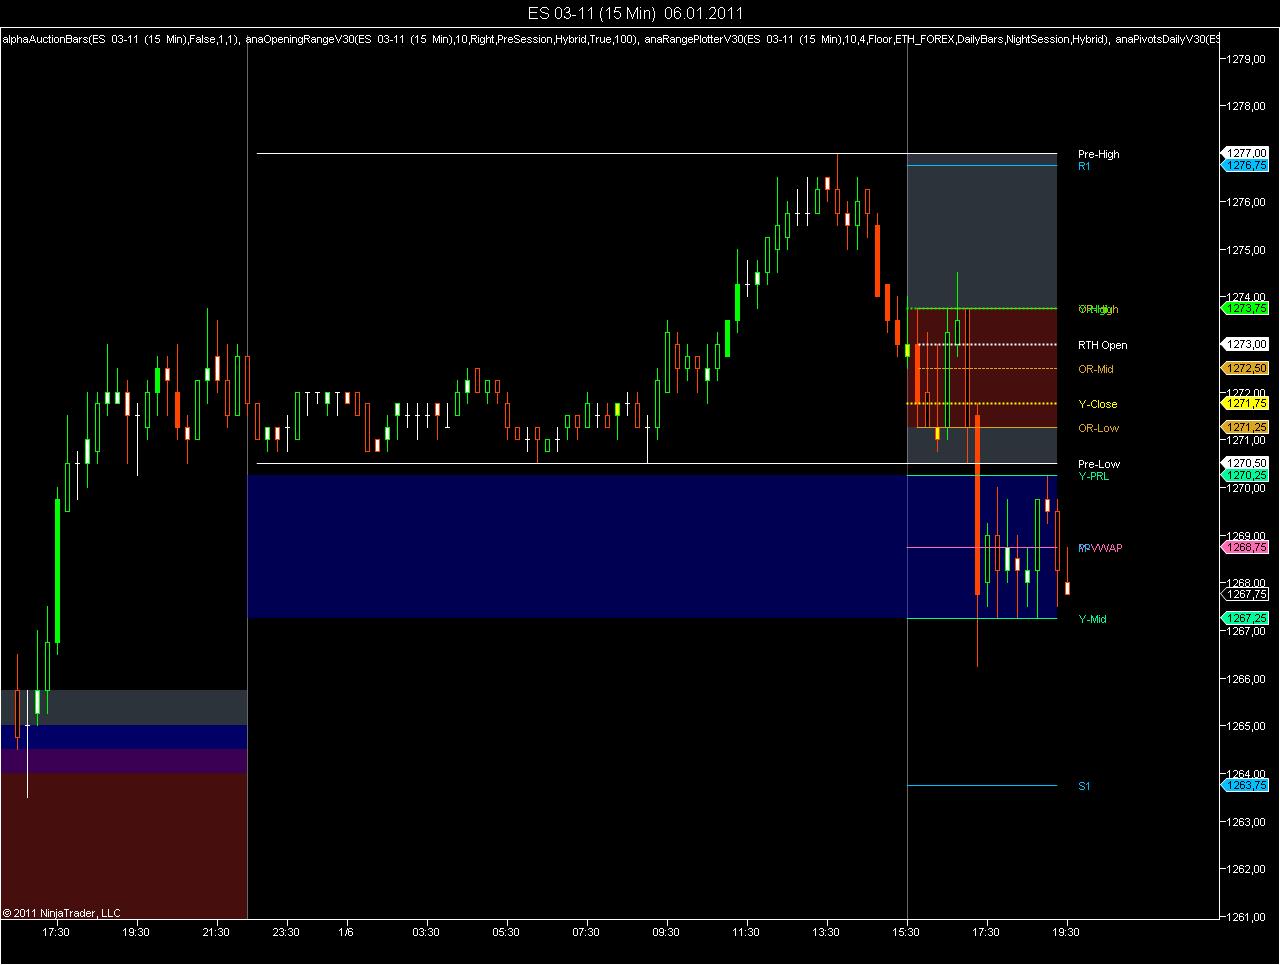
What I can see is that the blue range had been tested several times during the Asian session. Each test attracted some buyers, who drove price up again. This is bullish. Consequently ES moved up to the next meeting point R1 during the European session. 1:00 PM CET is a typical reversal time. Europe has achieved its move and now it is up to the US session to test the result and then either continue or reverse or do nothing.
Again the morning low was good for temporary support.
Now is this tradeable? You do not need to buy the blue range, or short R1 directly. Even if you wait for the confirmation, which means
- increased volatility for buying Y-PRL
- second entry for shorting R1
you will fell much better having seen those lines.
Professional traders certainly use them, because the use of support and resistance improves the reward-to-risk ratio.
Fat Tails, your explanation is plausible and i would concede it makes sense. However, even though your presentation is rational these lines have no predictive value. There is no way to know before the fact how price will react when it gets there but i am ready to admit they can help a trader 'feel' much better or more comfortable seeing these levels on a chart. That's why some people are ready to buy them but in reality i think they buy a certain level of confidence. And this aspect is behond the rational realm which in my opinion was at the core of this thread. I feel in resonance with the main tenet presented in this thread because last year i had begun to realise i was not really using these levels to take my decisions even though they were present on my screen. In the end, i undertsood i kept them there "to feel much better" as you wrote. I can take the same chart you took today and tell you where i would have entered without needing any of these preconfigured lines. Look, if price bounces off a given level as it did on the ES (see blue area), do i need to know its name or give it a label ? I can easily draw a line when price behaves like that but only when it gets there. since as you admitted you evaluate the reaction of price once there. I think all these lines are distracting and contribute to overload my mind with datas i don't really need.
I think that this was the intention of , when he started this thread. Too many lines do not help, a few lines might be useful. The main pivot also is a trendfilter, similar to VWAP or the POC.
I agree with your reasoning on entries. However, some of the lines are excellent exits, as they are attractors. They attract traders like the deer that is looking into the headlight of the approaching car.