Welcome to NexusFi: the best trading community on the planet, with over 150,000 members Sign Up Now for Free
Genuine reviews from real traders, not fake reviews from stealth vendors
Quality education from leading professional traders
We are a friendly, helpful, and positive community
We do not tolerate rude behavior, trolling, or vendors advertising in posts
We are here to help, just let us know what you need
You'll need to register in order to view the content of the threads and start contributing to our community. It's free for basic access, or support us by becoming an Elite Member -- see if you qualify for a discount below.
-- Big Mike, Site Administrator
(If you already have an account, login at the top of the page)
Yesterday we talked about the 2 significant prices:
Yesterday we basically traded between those 2 prices, so same thing applies today - just with a little more "energy" built up between the prices that will be released on a break.
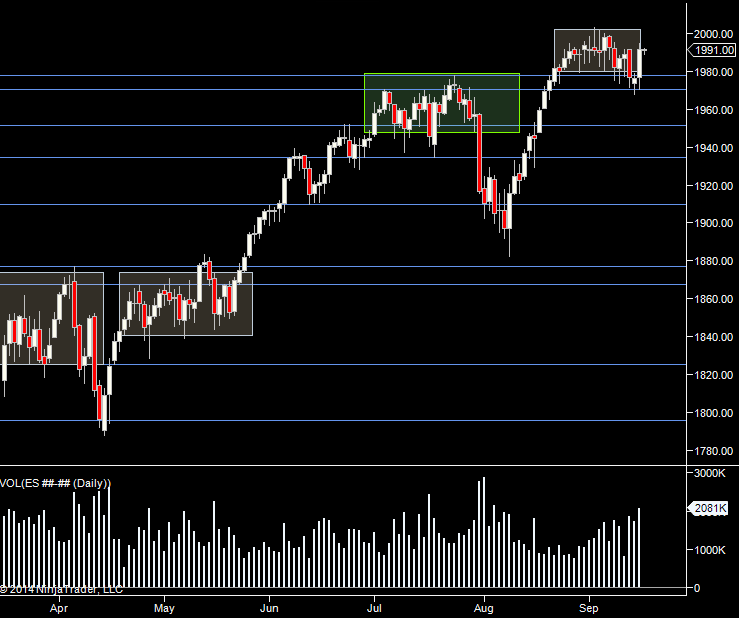
From a weekly perspective we can also see that we could not make meaningful headway into yesterdays value area. That should help bring sellers in if we get another test of yesterdays high and it holds.
As we go into today, if the range hasn't broken by the open (which could easily happen as we have inflation numbers @ 8:30), I'll be looking to see if either end of value holds from yesterday - 1972 & 1976.50. If that happens, I'll look to try to get on to play to the range extreme in the direction of the bounce off the level. If not, then watching around yesterdays range for a reaction. So from where we are, if 1972 holds, I'll try to go long and scale some before 1978.
If we start today outside of yesterdays range, I'll look for it to be tested after the pit open. A test and traders stepping in would give me confidence in a decent move.
The downside today is that I don't usually like to play levels. I like to wait for a move off a level and then get in on a retracement. That might be difficult to get if it bounces off an extreme and the other side steps in because yesterdays range is so small, it might just bounce and go through in one leg.
As per last week, I still feel the downside has a lot more potential for stops, so any downside move may be one you just have to jump on - the above is really about trying to get a lower risk entry.
Weekly Numbers
Range - 1971.25 -> 1998.75
Value - 1978.50-> 1991.50
S1 1966 R1 1992.75
Daily Numbers
Range - 1968 (globex)-> 1969.50 / 1979
Value - 1972 -> 1976.50
Globex - 1972.50 -> 1977
Settlement - 1976
Long Term - 2003, 1985.75,1977.75, 1971.75, 1959.75, 1947.50, 1936.50, 1917.25, 1906.50, 1891.25, 1867.50, 1839.50, 1825.25, 1796
If you have any questions about the products or services provided, please send me a Private Message or use the futures.io " Ask Me Anything" thread
Back into the end of summer range. Yesterday we had our first 2million contract day since the summer.
As per yesterday & Monday....
We eventually broke upside, into the old range and there were some stops there above us. The move up certainly wasn't sluggish as per my expectations I think that was helped out by intraday shorts getting trapped (more below).
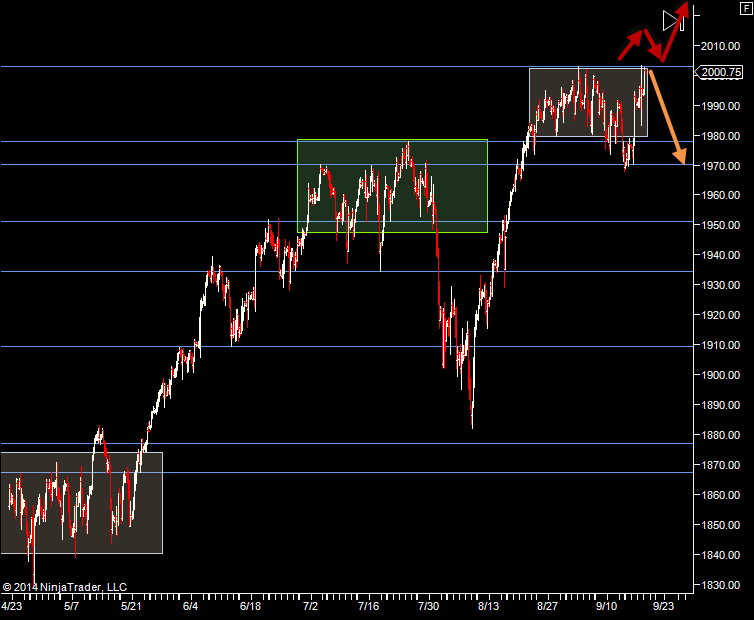
We now are back into the range. After yesterday, it's hard to see what would make sellers jump in at the top of the range again - around 2003. Still, the 2 scenarios are new highs or test the high & return to the low of the range. A move down from here without seeing the tops first it my least likely scenario.
Of course today is FOMC day so it's probably going to be a slow start then a move later on in the afternoon. You do have to wonder if this push up is not in anticipation of FOMC in which case it could go down aggressively in the afternoon.
We do now have enough of a base here to move on up and take longs with confidence. If we do break up, then I'm looking for a retest to 2003 before playing a long. I think fading 2003 is a tough trade and there's plenty of room to the downside to let it reverse and then get on board.
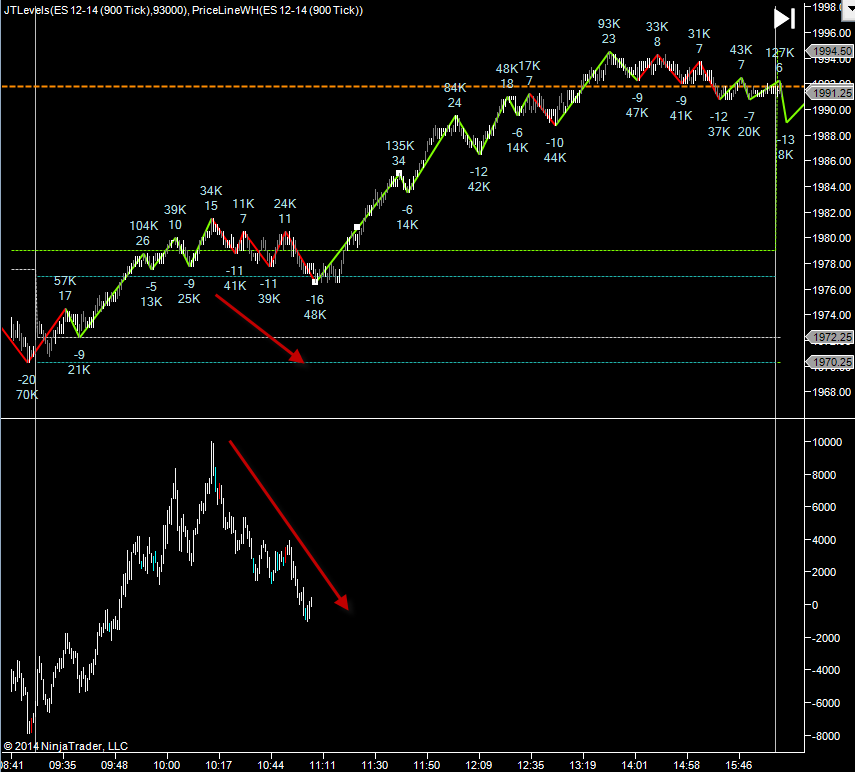
Yesterday we took a move down off the open and we couldn't quite get to the 70.25 level. Buyers jumped in and we popped up through 77.25. That 77.25 level then acted as support for an hour and it was heavily attacked and defended. The market did look like it was rolling over from 10:15-> 11:10 with sellers becoming predominant and delta sliding down. We got 5 ticks through the 77.25 level on the 4th attempt at the level but buyers just jumped in again. There was a massive step on the profile at 77.75/78.00 and bravo to buyers for grabbing it back.
Here's yesterdays chart (minus half the delta)... We can see how the market started to roll over and volume started to move to the sell side. We can see delta also came off 10k approximately but buyers just whacked them (blue line is overnight high). Shame we can't see the delta on this. That push up when the roll failed was partly the new shorts getting stopped out but it shows a lot of will on behalf of the buyers.
It's hard to see what will put buyers off at this point. I would not be surprised to see 2100 by the end of this year.
There must be some sellers licking their wounds today and there's no shame in being one of them either.
Weekly Numbers
Range - 1968 -> 1994.50
Value - 1969 -> 1978.50
S1 1966 R1 1992.75
Daily Numbers
Range - 1970.25 -> 1970.75 / 1994.50
Value - 1980 -> 1994.50
Globex - 1989 -> 1992.25
Settlement - 1991.50
Long Term - 2003, 1985.75,1977.75, 1971.75, 1959.75, 1947.50, 1936.50, 1917.25, 1906.50, 1891.25, 1867.50, 1839.50, 1825.25, 1796
Right n
If you have any questions about the products or services provided, please send me a Private Message or use the futures.io " Ask Me Anything" thread
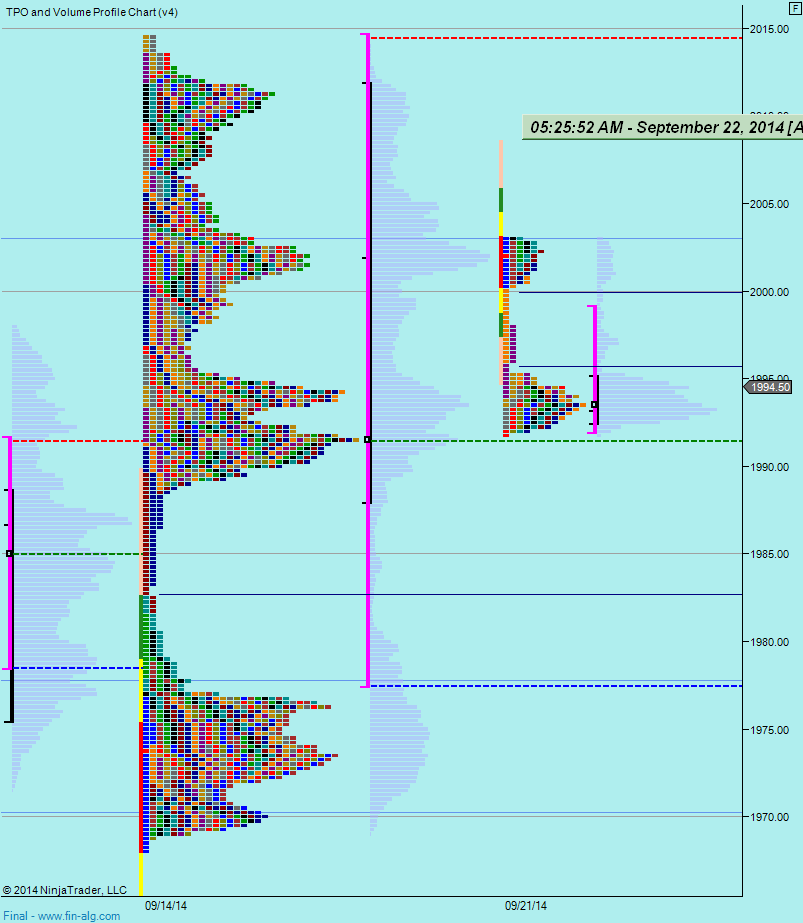
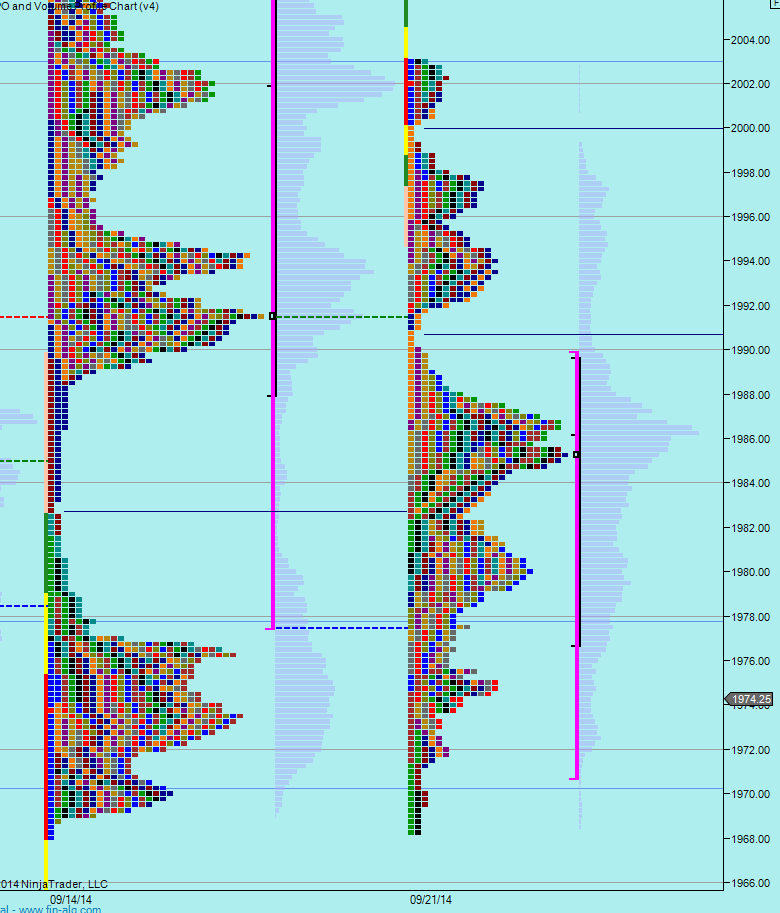
No big surprises yesterday. A slow morning then up to the all time high and we bounced off it.
So now, do we continue the range and go back to 1970.25 or are we going to push higher. We have unemployment numbers at 8:30am, so that might be enough to decide either way. If we do push through strongly, I'll be looking to see it come back to test 2003 and if that holds, I think longs can be high confidence.
If we do move down, we could find support at 1989. If that breaks, I think we could see a swift move down to 1978.
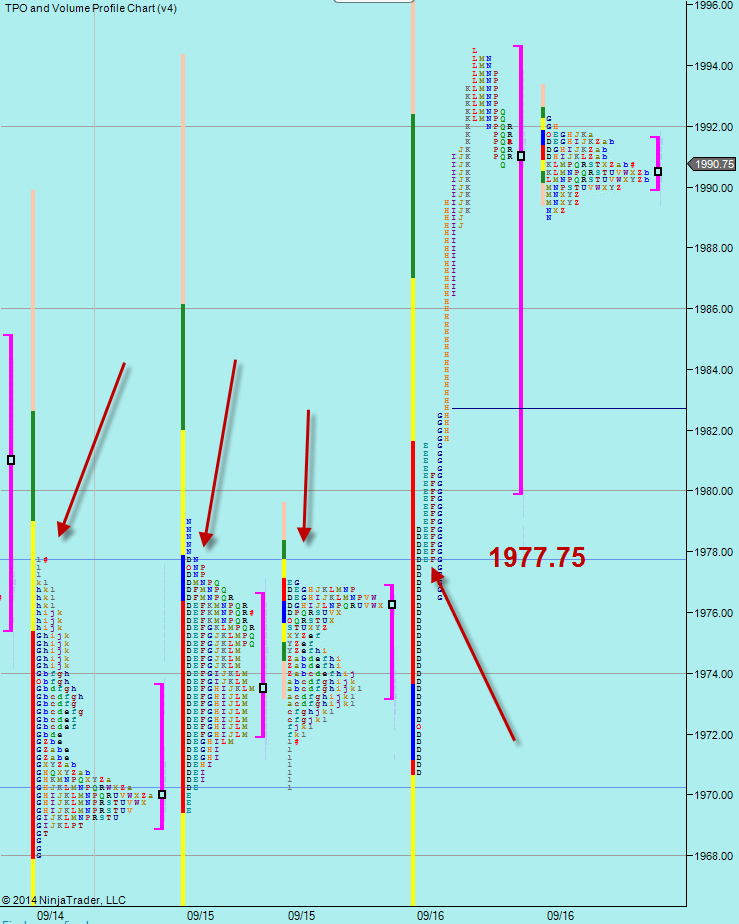
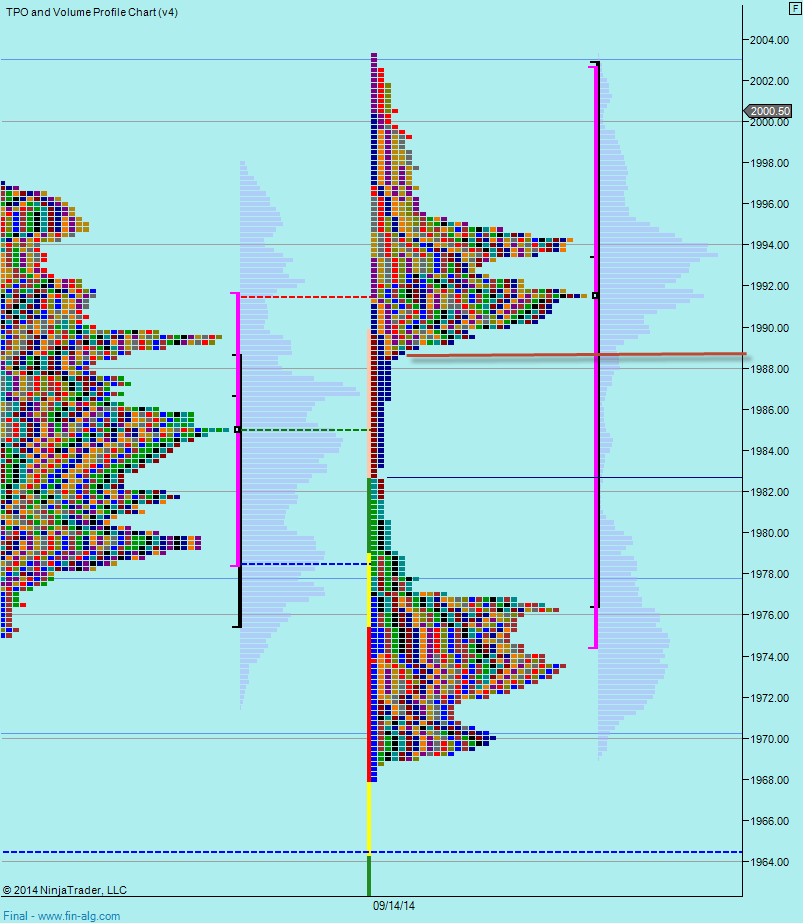
The split profile shows the 1989 level. We did have the wild "Fed Swing" in yesterdays afternoon but the dust has settled now. We have yesterdays value low at 1989.50, so if we do go down, that area should at least see a minor pop, even if it doesn't hold.
Sellers did try to break the range to the downside earlier this week, so it'll be interesting to see if they shy away today.
Weekly Numbers
Range - 1968 -> 2003.25
Value - 1974.50 -> 2002.50
S1 1966 R1 1992.75
Daily Numbers
Range - 1983.25 -> 2003.25
Value - 1989.50 -> 1997.50
Globex - 1993 -> 2002.50
Settlement - 1993.75
Long Term - 2003, 1985.75,1977.75, 1971.75, 1959.75, 1947.50, 1936.50, 1917.25, 1906.50, 1891.25, 1867.50, 1839.50, 1825.25, 1796
If you have any questions about the products or services provided, please send me a Private Message or use the futures.io " Ask Me Anything" thread
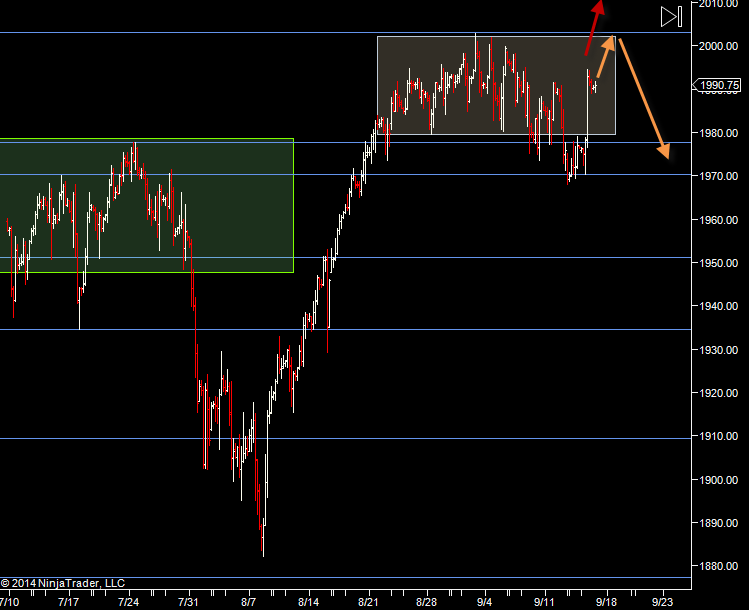
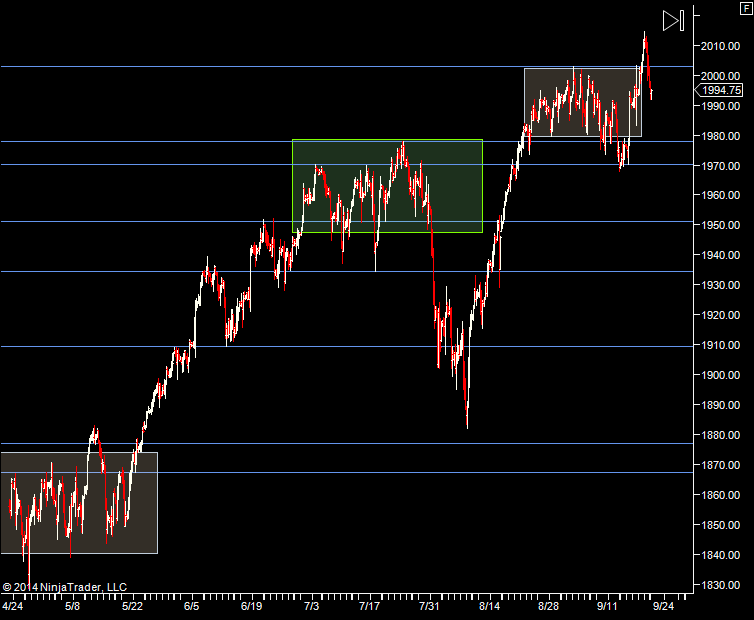
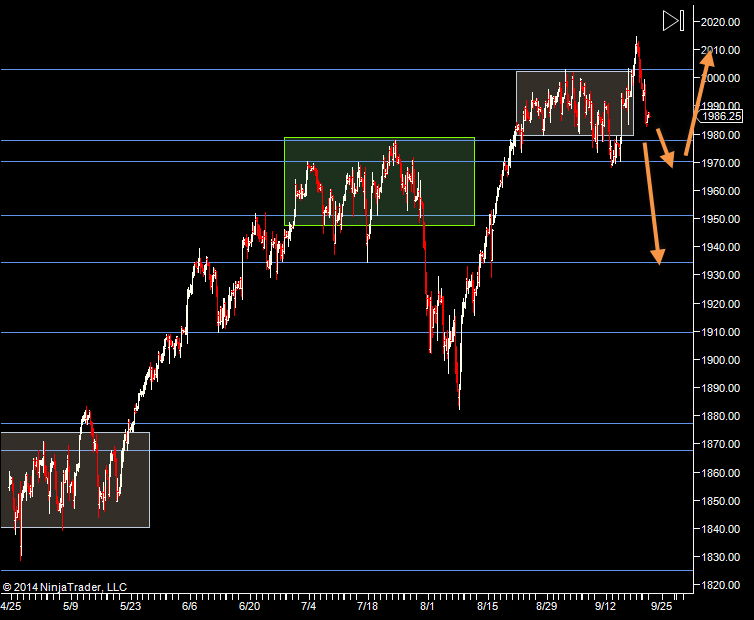
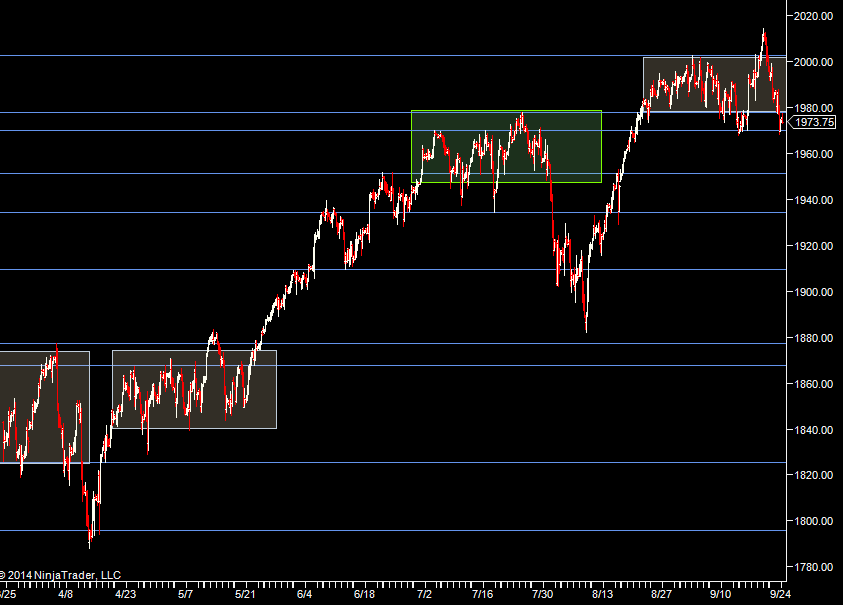
We had a good push up on Friday. We were looking to see a test of the old high (2003) for high-confidence longs. On Friday we rotated around that after the move up and in todays Globex session the old high has been resistance.
We have 2 scenarios to consider.
1 - We find support and continue climbing higher.
2 - We move down to the next 77.75 and complete the range of the past few weeks to the downside (white box above).
I was looking for support at 2003. That would have been a good 'tell' but as it hasn't happened, today I am looking for a line in the sand that could be support or indicate we'll move down to complete the range downside (and possibly beyond)
We can see that last week we have very thin trading between 1977 and 1989. So today we can look for acceleration to the downside if 1989 breaks. If it tests and holds, I'd expect for longs to jump in there.
We can see that todays Globex session topped out at 2003 so far. Going into today, bearish action from here be a move up to fridays low/value low and that get rejected. Similarly if 2003 gets tested again. That would leave room for a long into 1989. If we get into Fridays range, then we can look for a lower confidence long to the opposite end of the range. Any pullback to show support around 2003 would give us a higher confidence long.
The Globex session is entirely short, so we have to look for a snap up at the open, especially if we open at the lower end of the Globex range.
Also we do have a "bulge" on the globex profile at 1995.75, so that is a potential resistance point but it's a bit early to tell.
Weekly Numbers
Range - 1977.50 -> 2014.50
Value - 1974.50 -> 2014.5 (which is elongated enough to make it fairly useless)
S1 1976.25 R1 2022.75
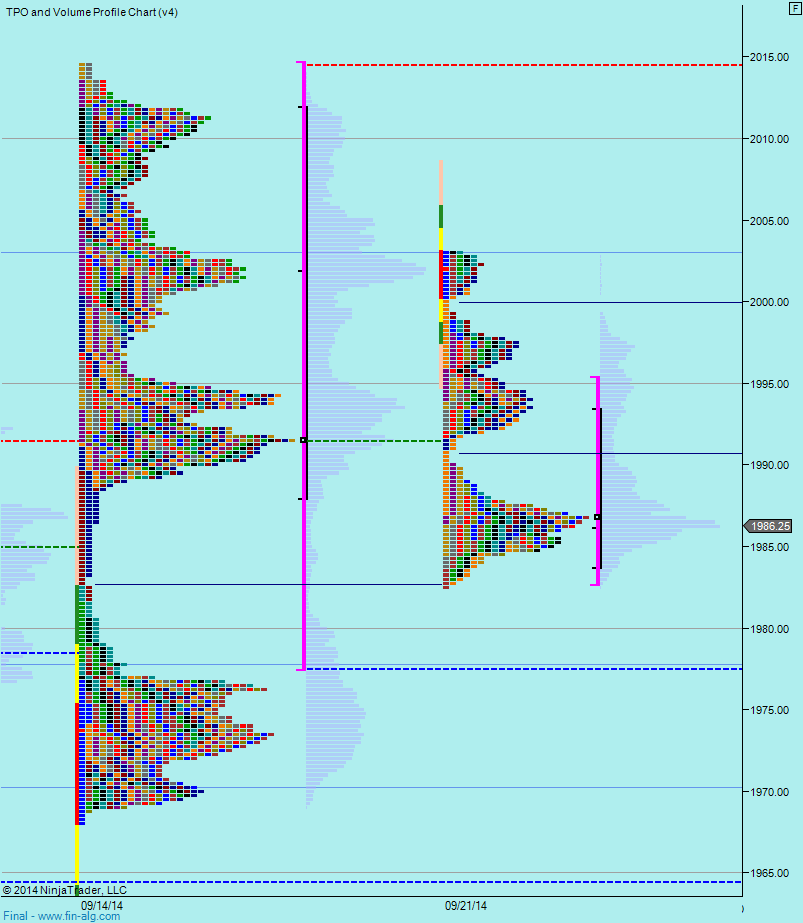
Back to the bottom of our now one month old narrow range. I'm looking for us to either find support at 77.75 or 70.25 or possibly collapse down. We did just range extend upwards, so we could now do the same to the downside, so I think even if we break 70.25 and sellers jump in, we might just push down to 1960 and not reach the next level down. That would give is a roughly 12 point extension which is what we had to the upside.
So today we look for something above to act as resistance for a short or the 70.25/77.75 to attract buyers for a long.
The weekly profile from last week has a lower distribution just below 77.75, which adds weight to the possibility of that area acting as support.
Yesterday we had
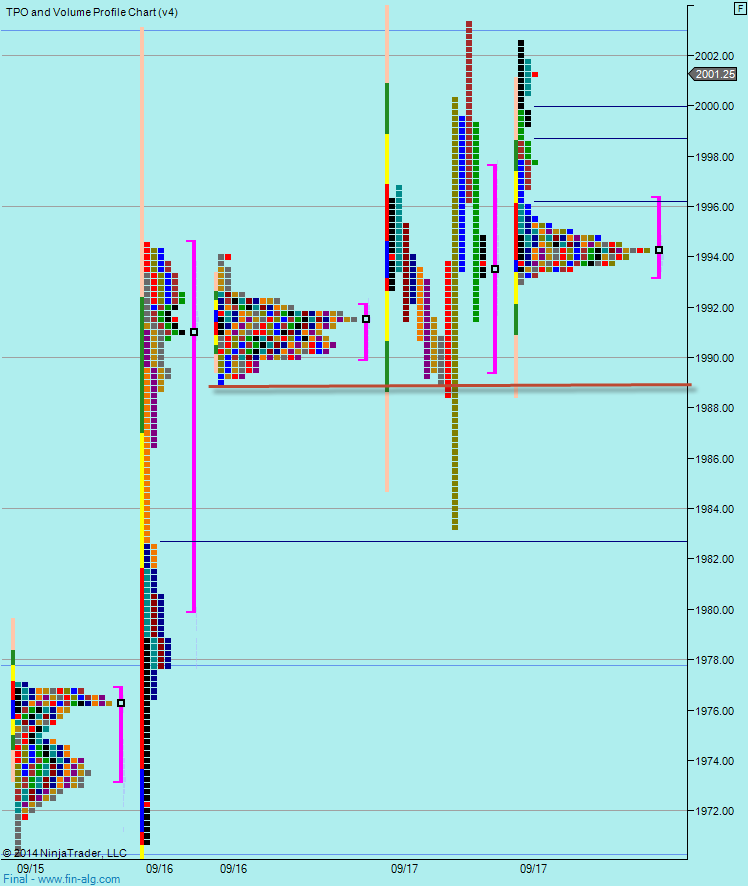
We didn't get acceleration below 1989. After moving through it,, 1989 became temporary resistance in "L" period in the above profile.
We did move to Fridays low and traded 4 ticks through it off the open sellers stepped in but not particularly aggressively till we had a retest about 10:08am and we couldn't make it as high as Fridays low.
Going into today, I'm initially watching 1989 to see if we get resistance there for a short. We've really lacked any decent selling momentum of late, so whilst I think we have potential for a sell off below 70.25, I am not sure what it will take to bring in decent selling.
If we pop up from here into the open. I'll consider longs of yesterdays key levels as we might not have momentum to get us down to 70.25/77.75
Weekly Numbers
Range - 1968 -> 2014.50
Value - 1974.50 -> 2014.5 (which is elongated enough to make it fairly useless)
S1 1976.25 R1 2022.75
Daily Numbers
Range - 1982.59 -> 1999.25 (pit) / 2003 (globex)
Value - 1983.25 -> 1989.75
Globex - 1982.75 -> 1987.75
Settlement - 1986.25
Long Term - 2003, 1977.75, 1970.25, 1959.75, 1947.50, 1936.50, 1917.25, 1906.50, 1891.25, 1867.50, 1839.50, 1825.25, 1796
If you have any questions about the products or services provided, please send me a Private Message or use the futures.io " Ask Me Anything" thread
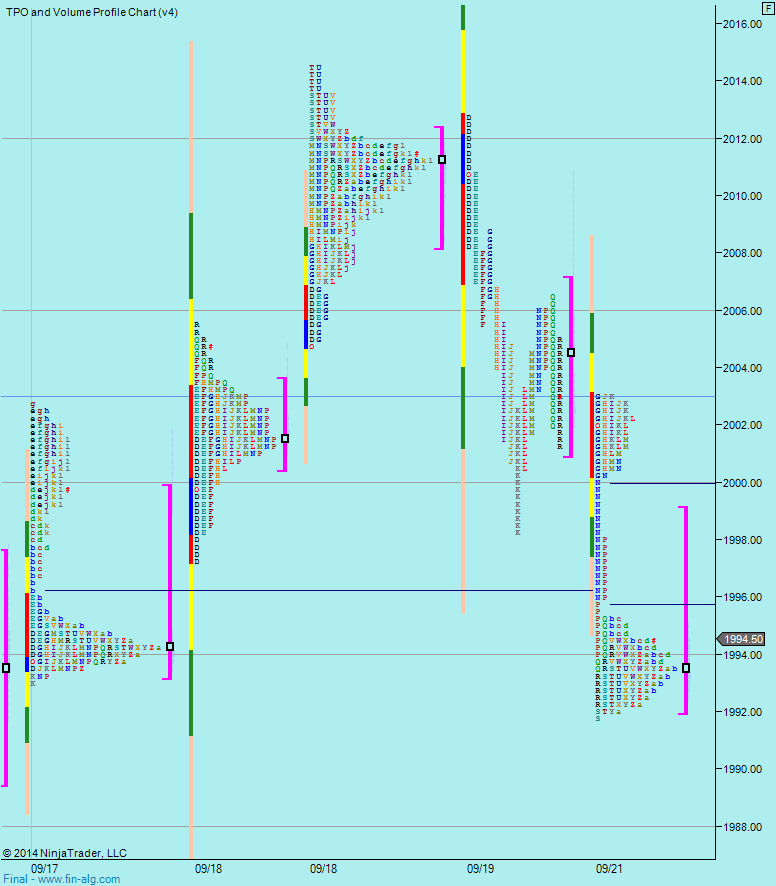
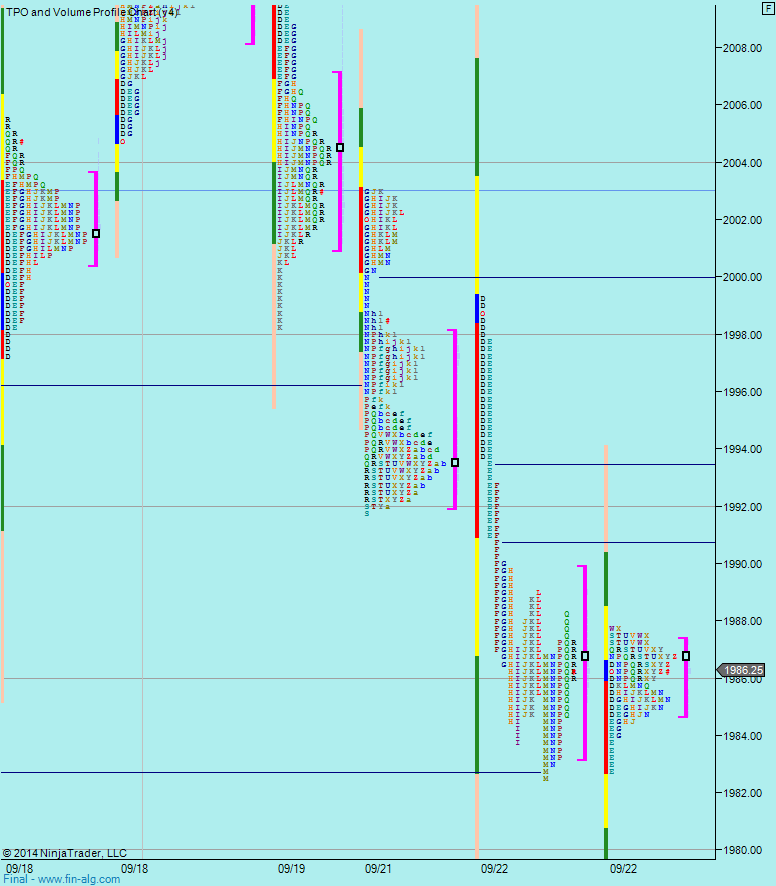
We bounced off the 77.75 level in the Globex session. The pit session saw buyers jump in a few ticks before 77.75 and we went up to the Globex high. We then had a sell off down to 71.50. In todays Globex session, we have dropped through the 70.25 level but not managed to hold below it
Today I'm looking for signs that this range is breaking to the downside, or if we are heading back up. For the downside, the nicest trades the market could give us would be a retrace to 77.75 or yesterdays VAL (77.50) for a short. That's also around the globex high as of 4:30am EST.
For longs, the 70.25 or Globex low would be nice.
If we do break down, we have to guage the amount of participation. It could be a large run if positions in the above range finally let go. Saying that, we really haven't seen much commitment from sellers.
Not much additional information here. We can see an elongated distribution more indicative of a trend day down we do have higher volume above 77.75 to 88. That gives weight to 77.75 holding and a lower probability hold at 88 if 77.75 can't hold.
We have gone 1 tick short of last weeks low, so if 70.25 breaks, then look for 68.00.
Here we can see 77.75 held from below in yesterdays Globex session and from below in todays Globex session. So not much to add to the above analysis. This Globex session we have held below yesterdays VAL too.
Same game at every range low basically.
Weekly Numbers
Range - 1968.25 -> 2003
Value - 1971.25 -> 1989.75
S1 1976.25 R1 2022.75
Daily Numbers
Range - 1971.50 -> 1988
Value - 1977.25 -> 1984.75
Globex - 1968.25 -> 1977.50
Settlement - 1975
Today 1989, 1968
Long Term - 2003, 1977.75, 1970.25, 1959.75, 1947.50, 1936.50, 1917.25, 1906.50, 1891.25, 1867.50, 1839.50, 1825.25, 1796
If you have any questions about the products or services provided, please send me a Private Message or use the futures.io " Ask Me Anything" thread