NexusFi: Find Your Edge


Home Menu


Pattern Seeker: my journal


Discussion in Trading Journals

Updated
      Top Posters
    1. looks_one Eiji with 10 posts (3 thanks)
    2. looks_two Big Mike with 1 posts (0 thanks)
    3. looks_3 PandaWarrior with 1 posts (3 thanks)
    4. looks_4 Quick Summary with 1 posts (0 thanks)
    1. trending_up 3,341 views
    2. thumb_up 6 thanks given
    3. group 2 followers
    1. forum 12 posts
    2. attach_file 9 attachments


Search this Thread

Pattern Seeker: my journal

  #11 (permalink)
 Eiji 
San Diego CA, USA
 
Experience: Beginner
Platform: TradeStation
Trading: YM
Posts: 22 since Jan 2012
Thanks Given: 12
Thanks Received: 5

Thanks Mike.

Well we made it to DisneyLand but I did get a chance to take a few trades before we left. I was a little distracted with the things going on with getting ready and such but I still wanted to watch the market and take trades as they set up.

Trade 1 - I went short just after the open as the price action looked to be breaking out of a consolidation. It was a late entry because my chart trading was set to 5 car and the price moved about 7 ticks as I scrambled to set it up. I watched profit evaporate and the trade go negative. I realized (a little late) this wasnt a pull back but rather a reversal and reversed the position for a loss of 33 ticks.
The why - break out of consolidation but should have set a target from my entry of about 15 ticks.
What I learned- Have more patience and dont take the opening move.


Trade 2 - The reversal. This was an intuitive decision to reverse the position instead of just closing the previous trade for a loss and looking for the next set up. I have watched a lot of opening moves reverse in the first 20 mins and thought this was going to be the case. Price consolidated pretty quickly in the trade and I held on and watched it break out and consolidate again and break out of consolidation again. I set a target and it was hit but I noticed that I had put an OCO buy above and below instead of an OCO sell . This smart move added a contract instead of closing the position as I intended. I scrambled to close the trade for +71 ticks. It would have been 75 if I wasnt such an idiot with the target order.

Why- Saw a change in trend and wanted to ride it.
What I learned- Be more conscious of the platform and place exits (targets and stops) with more care.


Trade 3- I saw a nice broadening formation forming in the NQ and watched as a candle pierced the lower trend line It did not close below the trend line and turned up. I went long and exited as it bounced off of the upper trend line for +30 ticks. I felt this was a very low risk trade becasue I would know if I was wrong right away if the price broke the lower trend line and I would reverse and take that side instead. The move up to test the upper trend line was very slow and I knew it didnt have the momentum to break out so I felt the exit at the trend line was a good call.

What I learned- I am learning and I can trade without emotions controlling me.

All in all a pretty good day. with a big loser and 2 big winners.

Attached Thumbnails
Click image for larger version

Name:	PA 022712.jpg
Views:	182
Size:	266.2 KB
ID:	63976   Click image for larger version

Name:	PA2 022712.jpg
Views:	197
Size:	246.7 KB
ID:	63977  
Visit my NexusFi Trade Journal Started this thread Reply With Quote

Can you help answer these questions
from other members on NexusFi?
Cheap historycal L1 data for stocks
Stocks and ETFs
Pivot Indicator like the old SwingTemp by Big Mike
NinjaTrader
Trade idea based off three indicators.
Traders Hideout
REcommedations for programming help
Sierra Chart
About a successful futures trader who didnt know anythin …
Psychology and Money Management
 
  #12 (permalink)
 Eiji 
San Diego CA, USA
 
Experience: Beginner
Platform: TradeStation
Trading: YM
Posts: 22 since Jan 2012
Thanks Given: 12
Thanks Received: 5

Well it has been a while since Ive posted. I realized that just finding patterns without any understanding of why they are forming and what part of the structure they are in just doesnt make any sense. It wasnt a clear plan that I could believe in. Just like I cant believe in MA crossovers. 2 lines crossing each other doesnt make a trading plan.

Gone are my range bar charts. Replaced with 60 min and 5 min charts with volume on one screen and daily charts on the other.

Lately I have been studying. pretty hard too.

Recently I was told that if I could learn to trade that I would be funded with a 50k account. That blew me away. It also let me know that someone believes in me. That felt good. It also scared me.

Well I reset my sim account to 55k and resolved to start trading. I still didnt know what the heck my plan was so I started watching the webinars here. Thank you Big Mike for all the educational opportunities here!
I really liked the Volume profile webinar and would love to learn it but I would have to change platforms, get a new broker and data feed so that was put on hold.
I then watched Dr. Gary Dayton's webinars on the Wyckoff method. Now I really got into that and could really relate to what Dr. Gary was saying. I've since started my journey into Wyckoff. The original materials from Wyckoff are a little hard to translate into futures trading for me. I hope to take the Chart Mastery from Dr Gary so maybe that will enlighten me a bit.
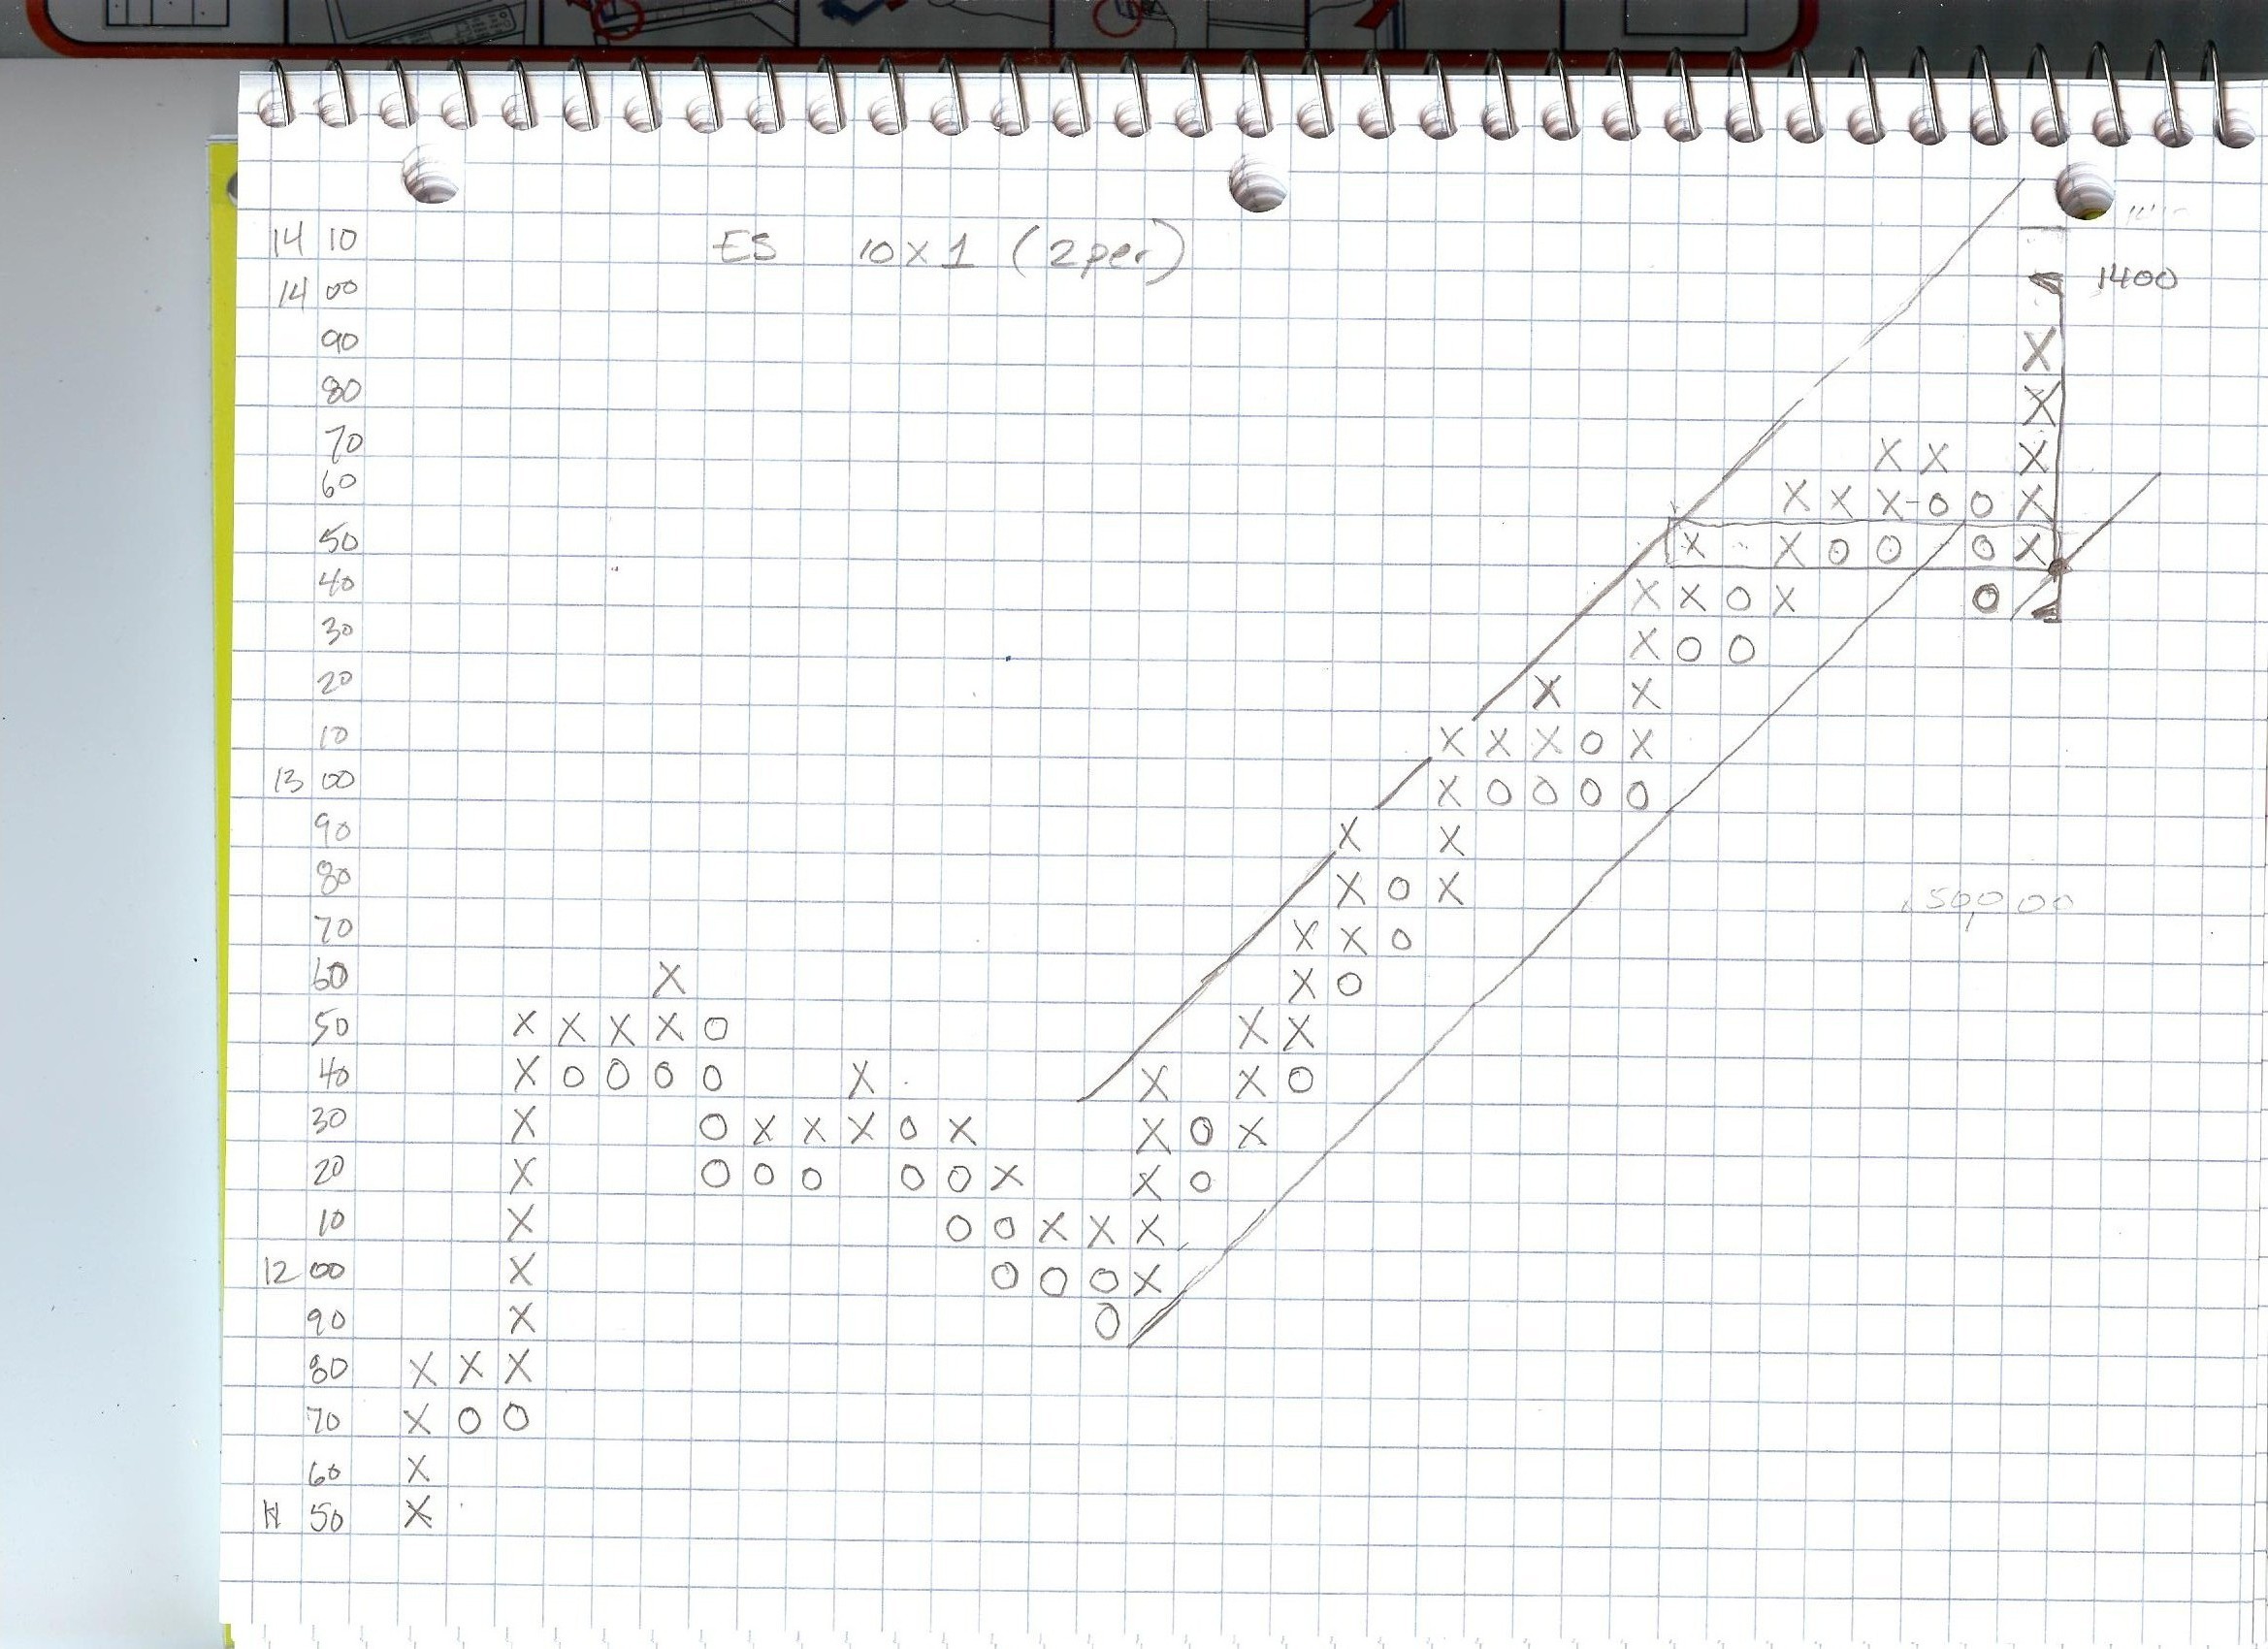
Figure charts are an important part of the Wyckoff method. I made the figure chart for the ES using a 10pnt x 1 reversal with a min of 2 boxes per column. My software doesnt do this configuration so I did it by hand. An upward breakout from the horizontal formation on the figure chart forcasted a rise to 1400. I resolved to exit at 1390.
2 very nice springs today highlighted on the 60 min chart. My trades are on the 5 min chart. I entered with 5 contracts and added 5 more before the second spring. I was trying to wait for the second spring but jumped the gun just a little.

Attached Thumbnails
Click image for larger version

Name:	PA031312.jpg
Views:	171
Size:	338.7 KB
ID:	66254  
Visit my NexusFi Trade Journal Started this thread Reply With Quote
  #13 (permalink)
 Eiji 
San Diego CA, USA
 
Experience: Beginner
Platform: TradeStation
Trading: YM
Posts: 22 since Jan 2012
Thanks Given: 12
Thanks Received: 5


Yikes, I see a mistake on the figure chart. oops it doesnt change the formation though.

Visit my NexusFi Trade Journal Started this thread Reply With Quote


Last Updated on March 14, 2012


© 2024 NexusFi™, s.a., All Rights Reserved.
Av Ricardo J. Alfaro, Century Tower, Panama City, Panama, Ph: +507 833-9432 (Panama and Intl), +1 888-312-3001 (USA and Canada)
All information is for educational use only and is not investment advice. There is a substantial risk of loss in trading commodity futures, stocks, options and foreign exchange products. Past performance is not indicative of future results.
About Us - Contact Us - Site Rules, Acceptable Use, and Terms and Conditions - Privacy Policy - Downloads - Top
no new posts