Welcome to NexusFi: the best trading community on the planet, with over 150,000 members Sign Up Now for Free
Genuine reviews from real traders, not fake reviews from stealth vendors
Quality education from leading professional traders
We are a friendly, helpful, and positive community
We do not tolerate rude behavior, trolling, or vendors advertising in posts
We are here to help, just let us know what you need
You'll need to register in order to view the content of the threads and start contributing to our community. It's free for basic access, or support us by becoming an Elite Member -- see if you qualify for a discount below.
-- Big Mike, Site Administrator
(If you already have an account, login at the top of the page)
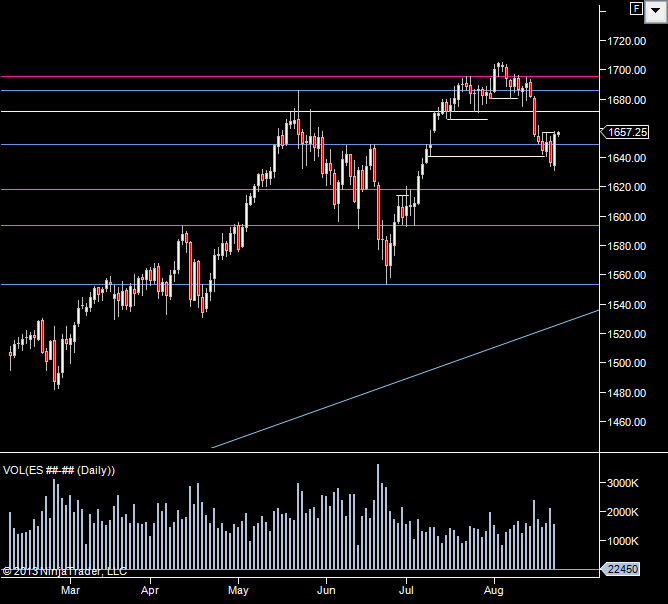
Since the runup to ES 1705, only 2 days out of 12 have seen the prior day's high broken, and the last 6 days has seen lower highs. The market is very short. There was heavy distribution in the 90s, and sellers have been very active in the mid 50s as well. But at some point they will be tested. Today has the best potential out of the last several, IMO, to really put the shorts to test, and I would not be surprised to see 60s. While lower highs have been put in, we are basically rotating and balancing since 8/15, albeit with a clear downward price discovery bias.
In summary, market short. Nice little rally to 1665 likely IMO.
For a LONG time, at least a year to 18 months, not just since May, the market has consistently rallied on bad GDP and NFP numbers (and any other bad numbers).
Also keep in mind that the taper is not the end. It's the beginning, a very SMALL beginning, to the end... of QE... which is nowhere near the end of what feels like a perpetual ZIRP environment we have been in for many years now. Just look at the negative reaction the market is having at a reduction of only about 30% of monthly asset purchases. That reduction would BEGIN at some point later this year maybe, and then depending on the numbers, it would be completely done sometime next year... maybe. And then, interest rates are still at zero.
If you are hoping the Fed doesn't cave.. well, I wouldn't hope too much for that. The fed is as prepared to open the valve wider as it is to close it. Their accommodative ZIRP crusade has been going for 5 years now. Do you think they will have a problem not tapering, and even increasing, asset purchases in this third/fourth round of QE?
IMO the markets changed @ the end of May - specifically with the breakdown of the inverse correlation between Bonds & Index futures. This ties in with specific announcements Bernanke made which he backtracked on later (and we saw a poke thru S&P highs again).
As for me hoping the FED doesn't cave? I think they should have extracted themselves from this years ago.
If you have any questions about the products or services provided, please send me a Private Message or use the futures.io " Ask Me Anything" thread
Definitely from the May 22 Bernanke taper drama, the two have been less correlated than what might be thought of as "usual." But yields have continued to rise, while at the same time equities went on to make new all time highs, and have only pulled off slightly from there, while bonds have continued to plummet. There is a general sense of weakness in both, but bonds have remained very depressed since early May, while the S&P has made all time highs, pulled back, made new all time highs again, and pulled back again. In other words, equities are still moving up, while bonds have been absolutely hammered.
Throw up a correlation and you'll see that over the years there are periods of positive correlation (in fact, see the March to May period this year for a nice run of this). The markets may have changed more in May, but they go through cycles of this. When there is a negative correlation between the two, this is indicative of a risk on/off paradigm. "Flight to safety," "risk off," as money flows out of stocks and into bonds, and vice versa. But there are significant periods where the risk on/off paradigm just is not as much a theme, such as the case since May. In this case, it's more of a "taper on/off," as the threat of slightly tighter policy bodes poorly for both bonds and stocks, so they move in tandem. The entire period of 2003 to 2007 shows bonds and stocks doing a lot of flip-flopping, where they move together for some time, then diverge, and repeat.
In short, I agree that things have been different since May, but observation of this phenomenon can be made throughout the past several years.
Carrying on from what Josh wrote above. I think the FED tapering is going to take a while for traders to figure out. If they stop supporting the markets, there is an argument for them going down.
I have a friend that runs an open outcry USD/THB desk in Thailand. His job is to put buyers and sellers together and try to create a bit of demand if it doesn't exist. Anyway, they did US$1BN yesterday, which is a lot for them.
Emerging markets like Thailand tend to do better when US indices rise but worse when US indices fall. The SET50 (Thai stock index) has been falling and money is being pulled from the country. This is just one emerging market. This is a direct result of the tapering announcements.
I think that this leaves us with an interesting question - where will the money being pulled from emerging markets end up?
As for today, we have a spanner in the works as far as trading the ES goes. Apparently NASDAQ broke yesterday and no-one knows why it got broken. I'll leave braver traders to play the markets today, at least until the official excuse comes out and we have some assurances there will be no recurrence.
In terms of where we are, we still haven't managed to escape the 1650 area. We did take a jump down at the FOMC but then we sprang back yesterday.
My overall bias is back to neutral and I'm considering the possibility we might just build a range at these levels as opposed to it being pivotal.
No levels today because I don't really trust them seeing as the NASDAQ was shut down yesterday afternoon.
If you have any questions about the products or services provided, please send me a Private Message or use the futures.io " Ask Me Anything" thread
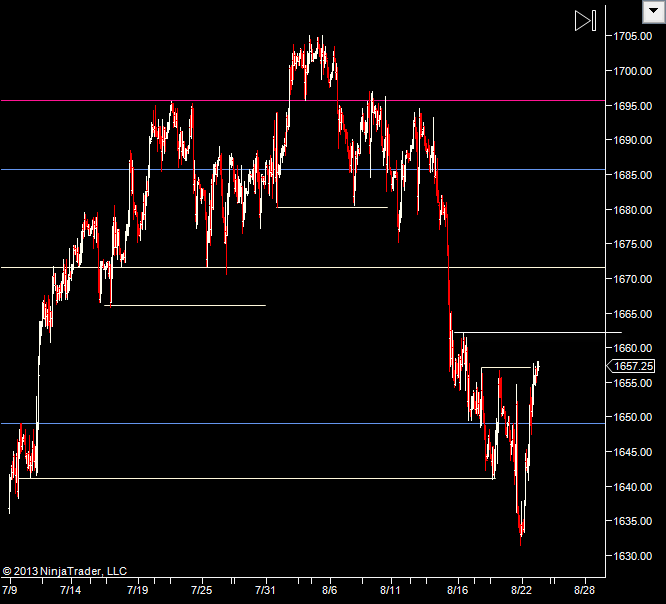
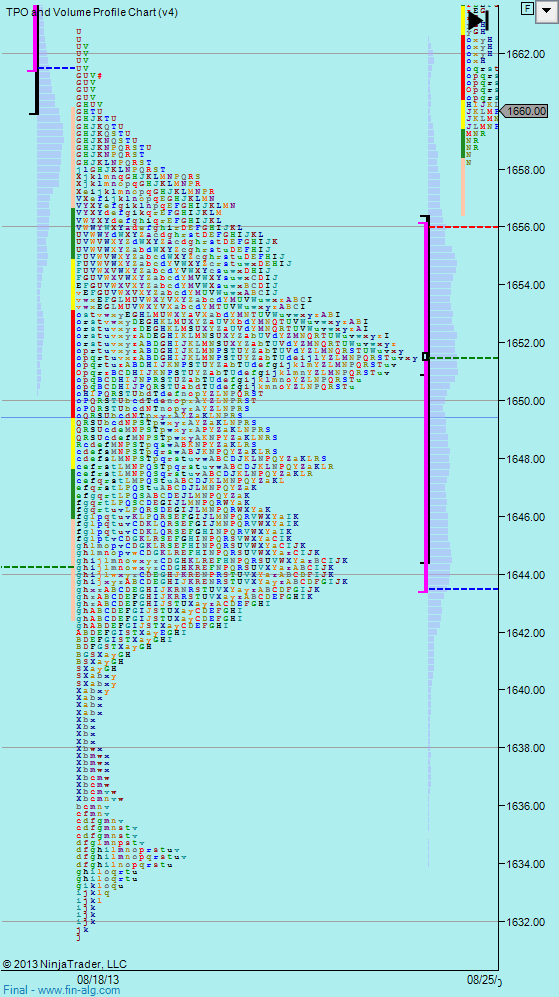
Buyers stepped in at the end of last week and now it looks like we might be headed back to the highs again. My bias is going to be long today but I would like to see this 1657-1658 level hold and for us to move up through 1666.
The double line there is the 1657-1658 level and it was significant resistance last week and it needs to hold otherwise we could just drop back into last weeks range for more of the same.
The next level up is at 1666.25, an area we have been watching for a while. We poked through that 3 ticks to 1667 and then down to the old resistance at 1658.25, so now the bulls need to make that support and take it up from here and towards 1671.50.
That puts us back into the range at the top from 1670-1705.25.
Obviously, any of these key levels can fail and I'll be watching for people to jump in regardless of whether the level holds or fails.
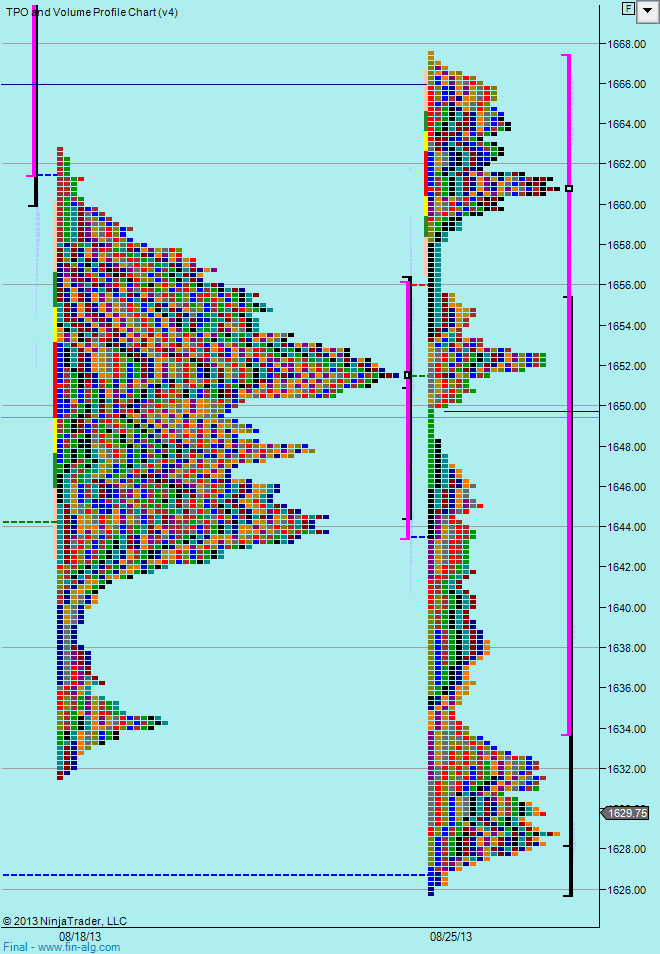
The weekly profile is below us with value high at 1656, not far from out 1657-1658 level above. So again, a good reason for longs to want to not go below this level because they'll want us to build value above last week and not traverse last weeks value area.
The daily profile sees us one timeframing upwards. The globex session has mostly traded around yesterdays close and so isn't particularly long or short and shouldn't cause any rebalance at the open. Fridays value high is 1659.75 and the POC is down at 1657.75, so again, the same area for profile traders to want to defend.
Of course, the flip side is that bears will definitely want to push it below these levels and if they do, we could have a nice run to the downside.
Weekly Numbers
Range 1631.50 ->1662.75
Value 1642.50 -> 1656
S1 - 1644, R1 1670.75
Daily Numbers
Range 1650.50/1652.25 -> 1662.75
Value 1655.75 -> 1659.75
Globex 1658.25 -> 1667
Other : 1657-1658, 1662.50, 1666.25, 1671.50, 1685.75, 1689, 1695.25 -> 1695.75, 1705
If you have any questions about the products or services provided, please send me a Private Message or use the futures.io " Ask Me Anything" thread
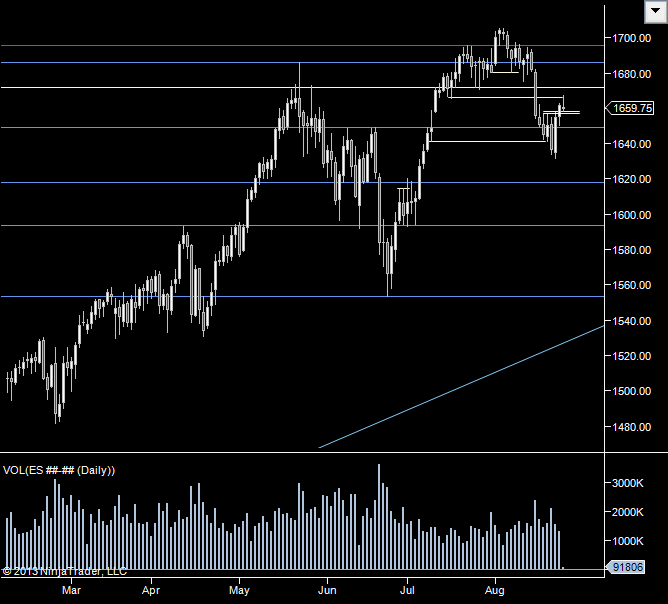
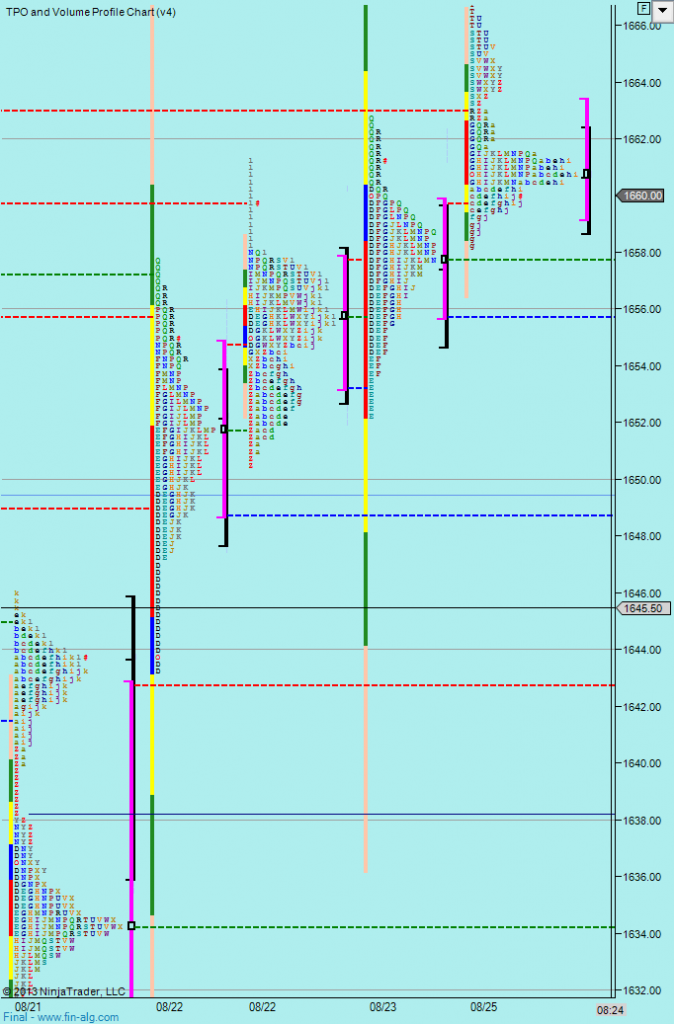
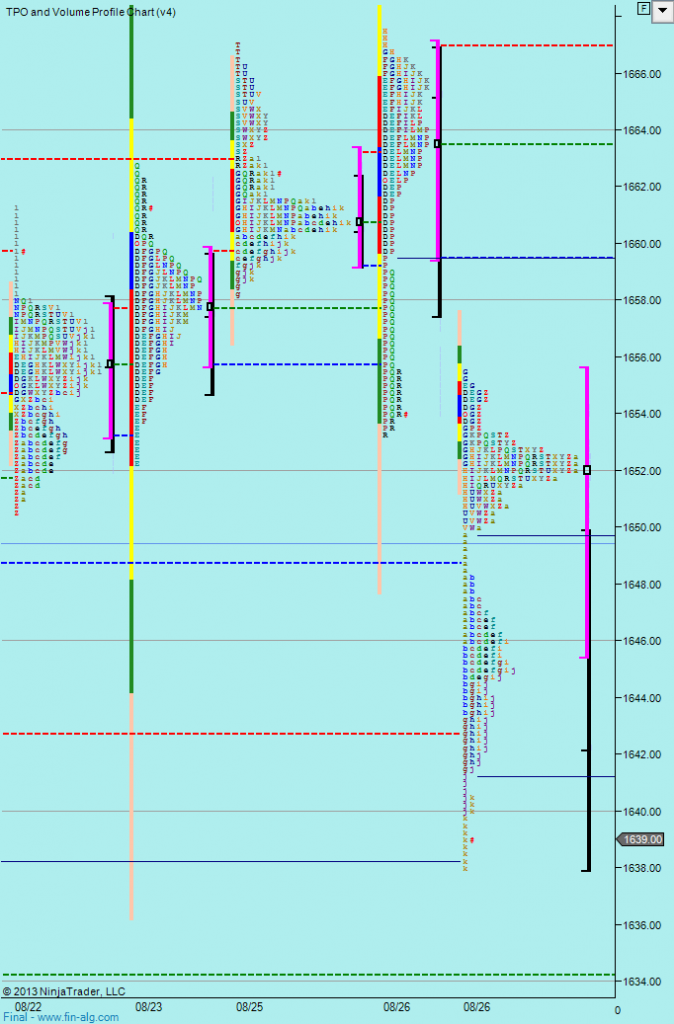
Will be watching the volume today, it's been to the low side the last few days and I'm looking for a clue as to whether we are going to make a push downside after failing to hold above the 66.25 level.
We have consumer confidence at 10am and that may help us break last wees low of 1631.50. Otherwise, it'll be another rotation in this 1630-1667 range we have been marking out.
Since we started watching the 1650 level back on the 18th, we have rotated around it. In effect we've been building value there. Each time it leaves 1650, the range expands a little but more, so if we do break last weeks range to the downside today, we have to be aware it might just be an extension and we need to pay attention to volume and order flow before playing a continuation trade.
We can see that this weeks range is almost the size of last weeks. Last week, we had a lower distribution at the bottom which has a POC around 1634.25 be aware that it might get a little thick in this area and we may just poke through it before returning up and back into last weeks value.
Almost all trading in the globex session has been below the close which makes overnight inventory very short. Also the range of the Globex session is almost 20 points. This often causes a snap back up on the open so be on the lookout for that.
Weekly Numbers
Range 1631.50 ->1662.75
Value 1642.50 -> 1656
S1 - 1644, R1 1670.75
Daily Numbers
Range 1653.25 -> 1667.50
Value 1659.75-> 1667
Globex 1635.75 -> 1655.25
Other : 1617.50,1631.25-.50, 1634.25, 1650, 1657-1658, 1662.50, 1666.25, 1671.50, 1685.75, 1689, 1695.25 -> 1695.75, 1705
If you have any questions about the products or services provided, please send me a Private Message or use the futures.io " Ask Me Anything" thread
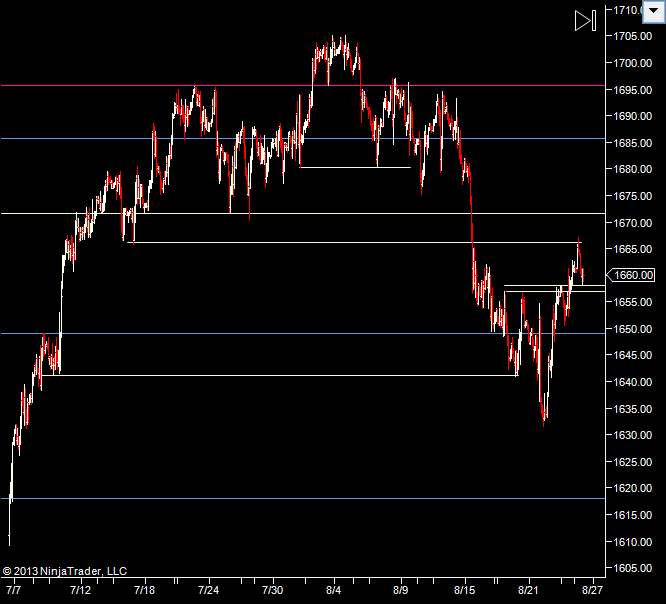
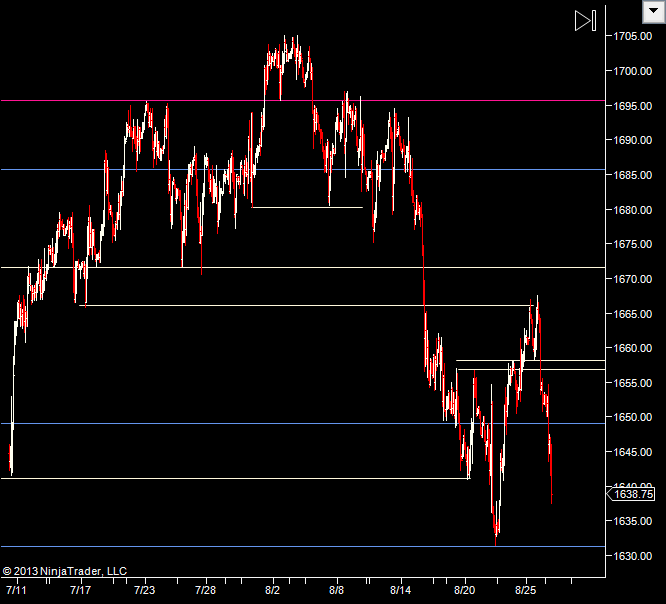
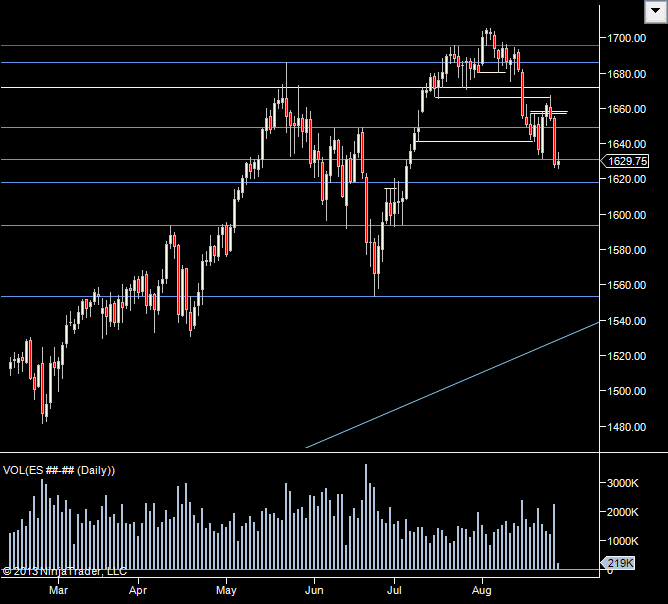
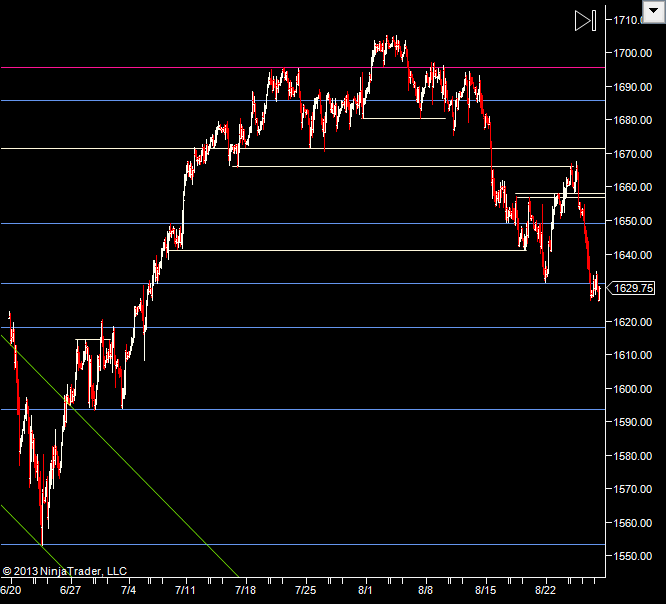
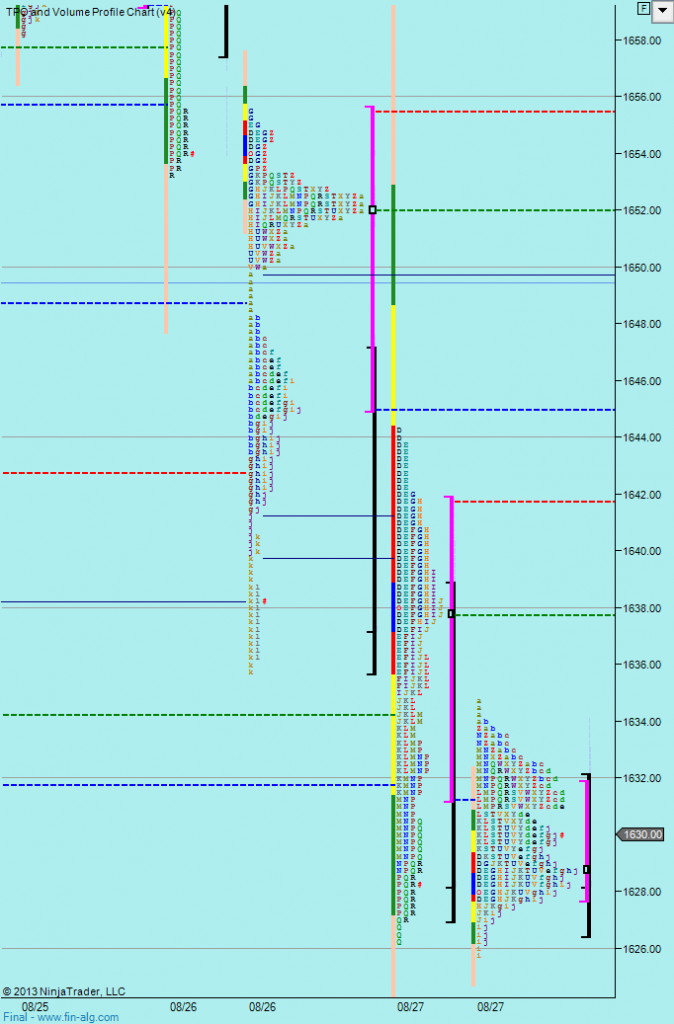
So, we have had our range extension downwards. Now the question is if we will carry on down towards 1600 & then 1550.
I changed this chart from 90 mins to 120 mins as you couldn't see enough of the action. I could see a few possibilities playing out today.
- move back up to and head towards 1670
- fake back up to 1641 and then roll down
- move down to 1617.50, bounce off it as support, move thru, then bounce off it as resistance
These are just scenarios I have in my head, just in case one of them plays out. As usual, ranges always look like they will fail and this expanding range since the 18th August has done that plenty of times, so I'm not completely writing off the upside.
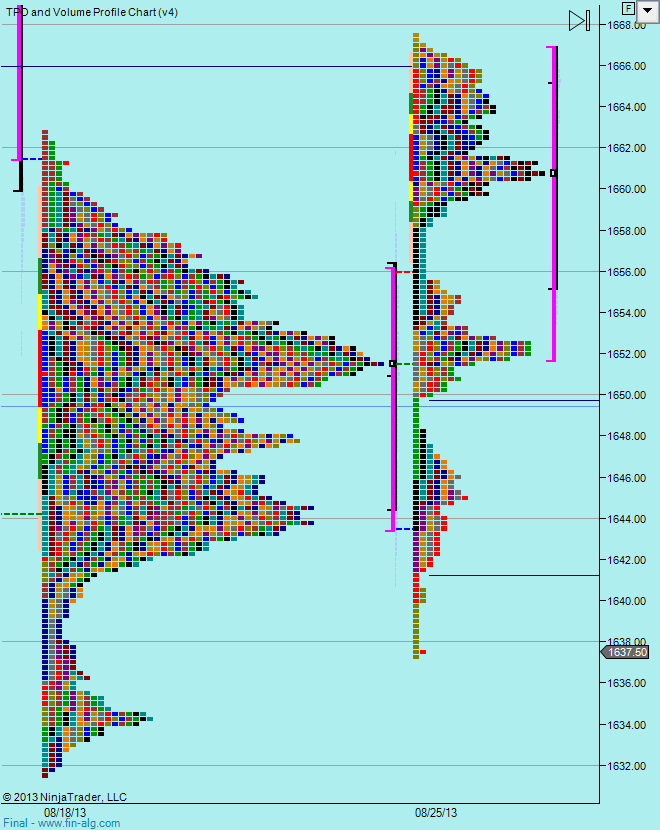
We got through the bottom of last weeks range, and we can see 4 distributions down this week. The lower one being the largest. Continued acceptance of lower prices is good for the downside.
We made no headway down in the Globex session. We have home sales at 10am and bombs dropping in Syria any time now potentially, so I'll watch the depth, if it suddenly all disappears, I'll careful if I don't have much breathing room in a trade. It's definitely a day to keep an ear on the squawk.
Weekly Numbers
Range 1625.75 -> 1667.50
Value 1633.75 -> 1667.25
S1 - 1644, R1 1670.75
Daily Numbers
Range 1626.25 -> 1644.25/1655.50
Value 1631.25 -> 1641.75
Globex 1625.75 -> 1634.50
Other : 1593.74, 1500, 1617.50,1631.25-.50, 1634.25, 1641, 1650, 1657-1658,
If you have any questions about the products or services provided, please send me a Private Message or use the futures.io " Ask Me Anything" thread