



Market Making and Liquidity Provision on Futures Exchanges: Who's on the Other Side of Your Trade and Why It Matters
Overview #
Every time you hit the bid or lift the offer on a futures exchange, someone is on the other side. Not just "someone" — a specific participant with a specific economic model, specific obligations, and specific risk limits that dictate how aggressively they'll quote, when they'll widen, and when they'll pull out entirely.
Market makers are the participants who provide that other side. They post resting orders at the bid and ask, earning the spread when they're filled on both sides and managing the inventory risk that accumulates between fills. On major exchanges like CME and ICE, some of these participants operate under formal designation programs with measurable obligations and incentive structures. Others — especially high-frequency trading firms — provide liquidity opportunistically based on short-horizon signals and microstructure edge.
Understanding how these participants operate changes how you trade. The spread you see isn't a fixed cost — it's a dynamic outcome of competition, risk, and regime. When you understand what drives that spread, you make better decisions about order type, timing, and size. That's the game.
How Market Makers Function #
A market maker on a futures exchange does one thing: posts simultaneous buy and sell orders around their estimate of fair value, aiming to earn the difference between the bid and ask while keeping inventory near neutral.
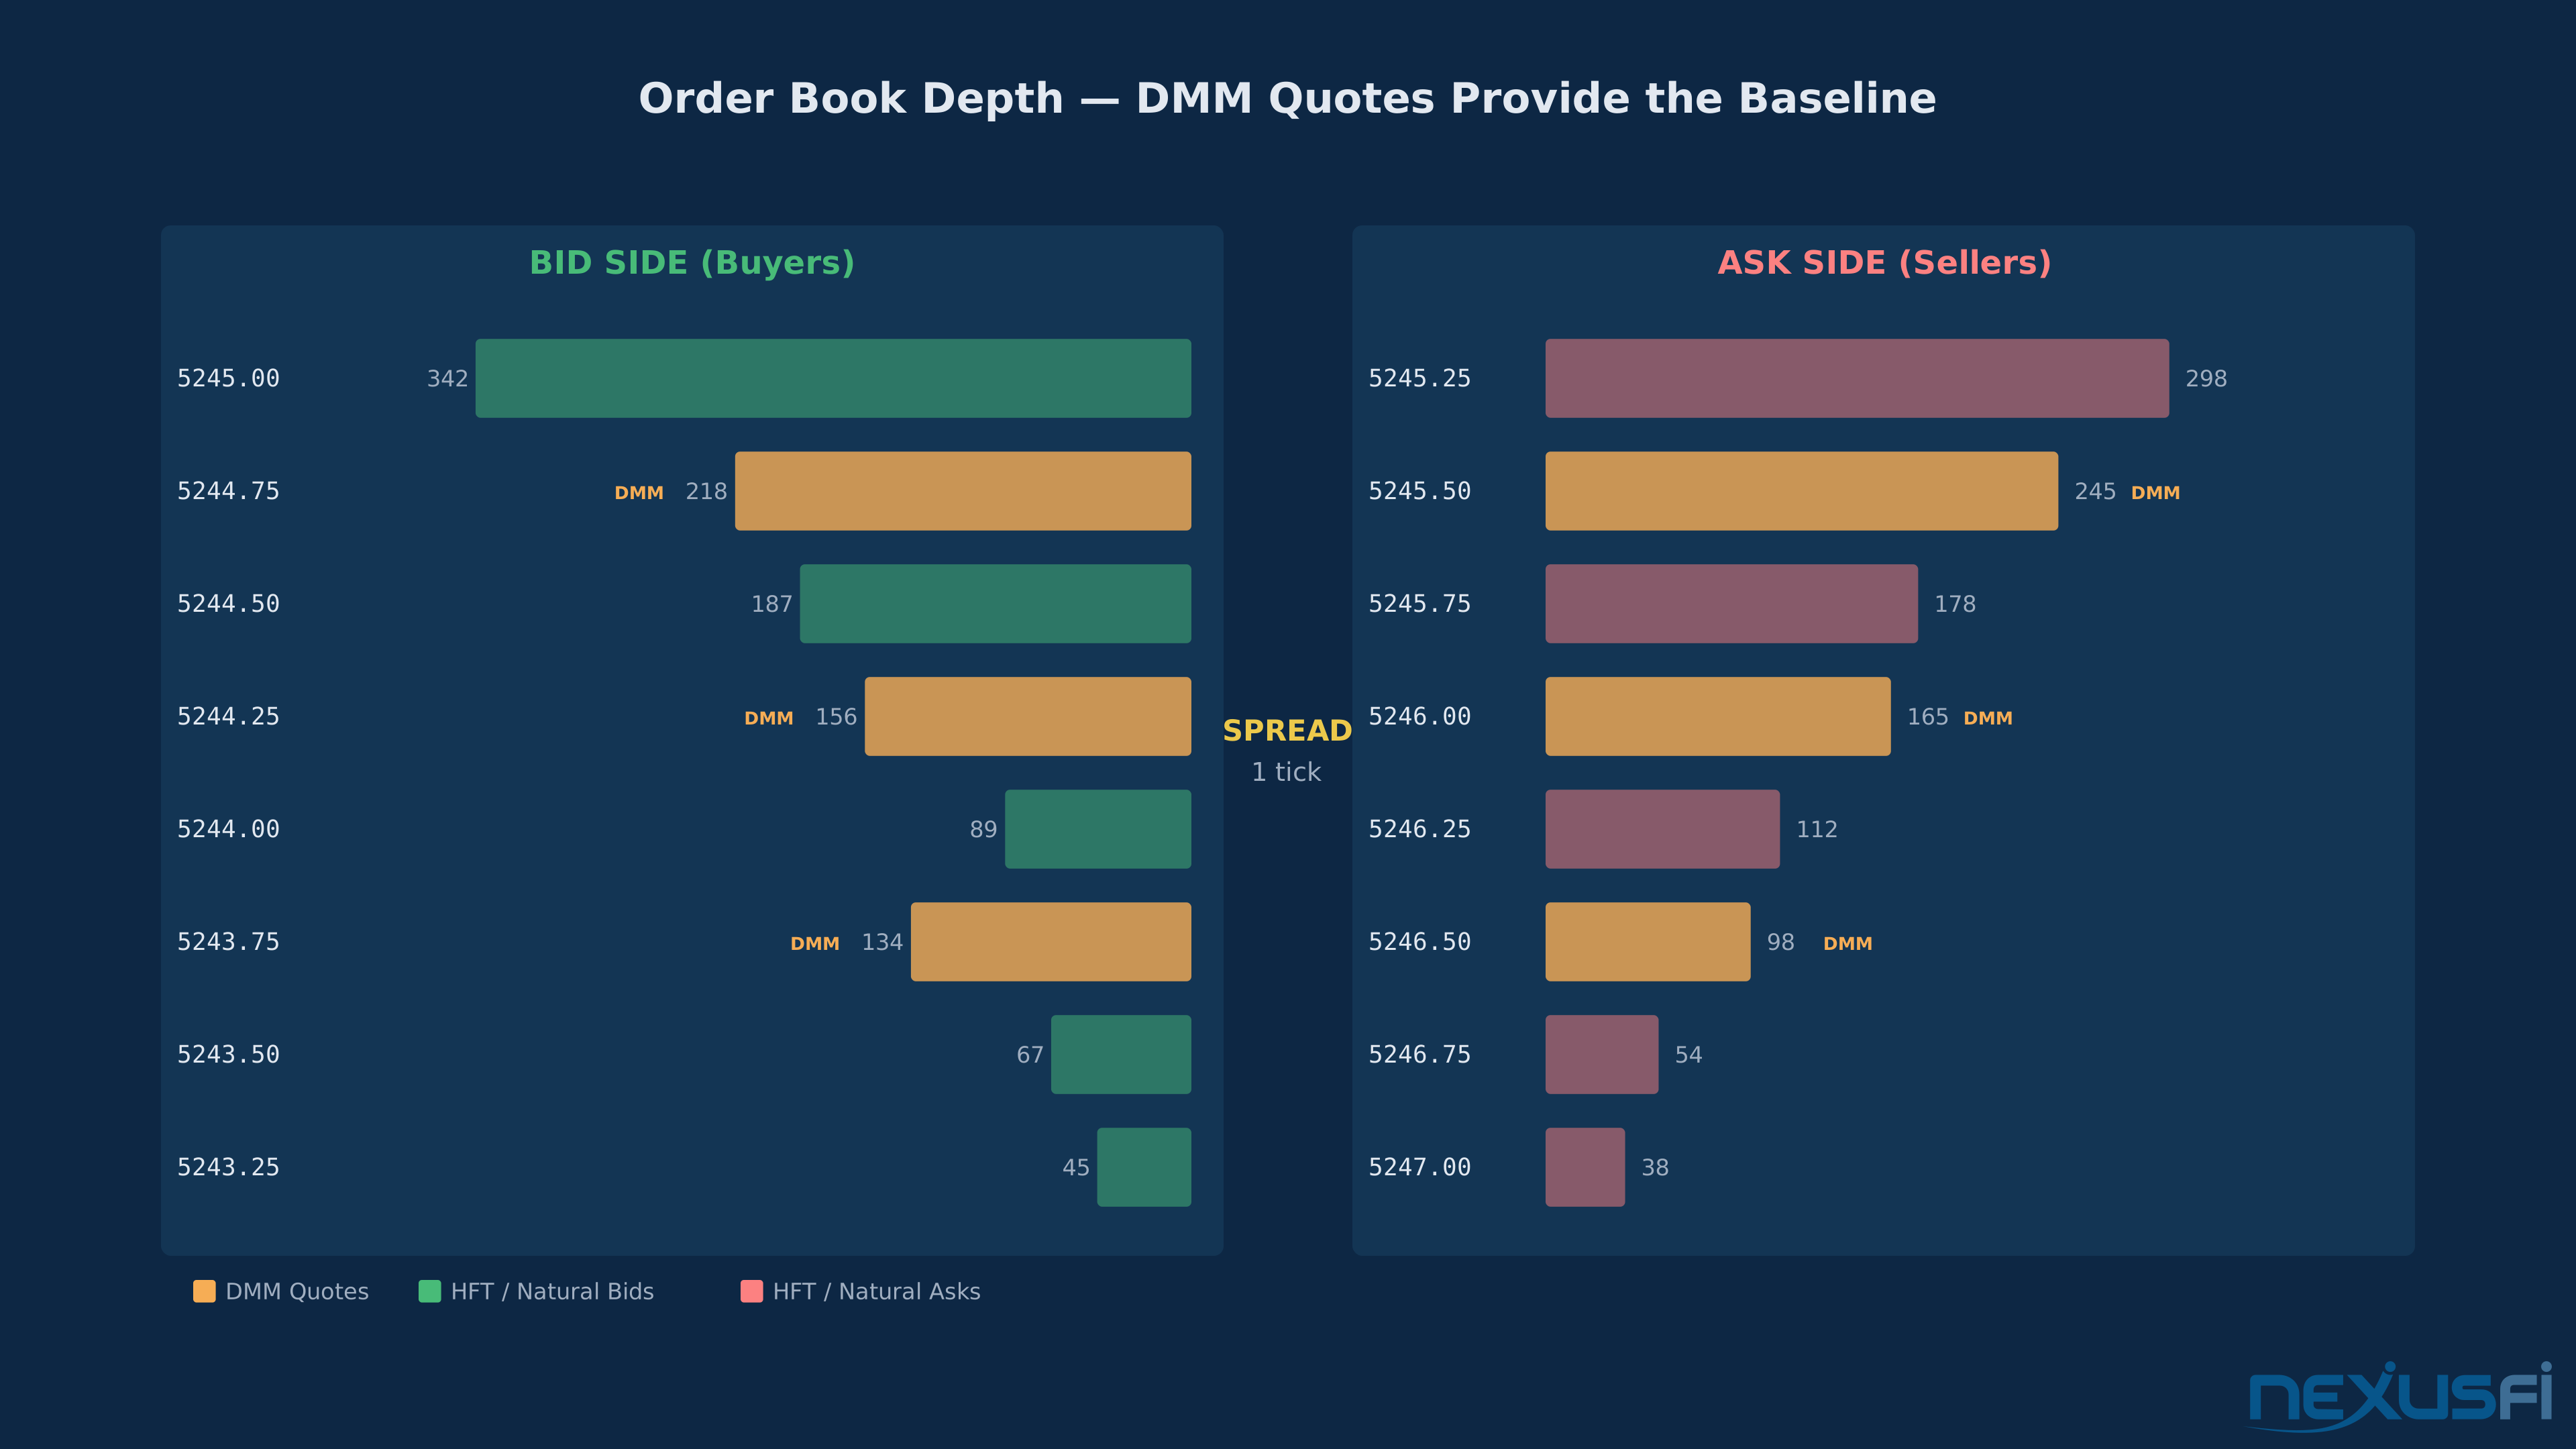
The math is straightforward. If ES is trading at 5245.00/5245.25 and a market maker buys at 5245.00 and sells at 5245.25, that's a 1-tick ($12.50) gross profit per round turn. Multiply by thousands of round turns per day, subtract adverse selection losses and technology costs, and you have the market making business model.
But it's not that simple in practice. The market maker faces three constant threats:
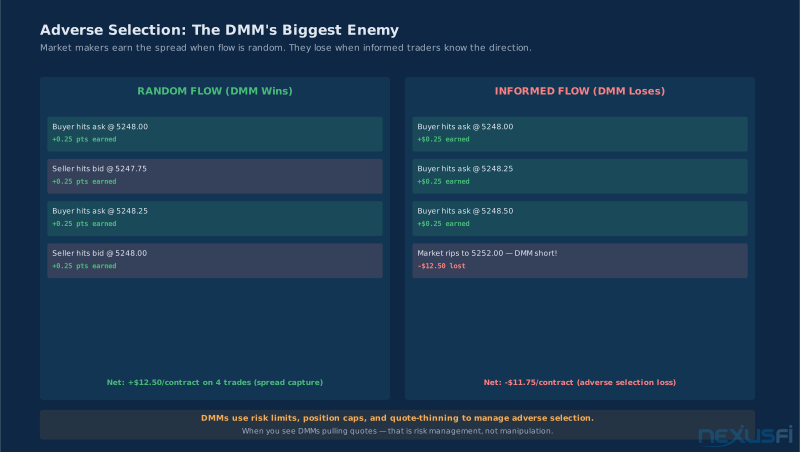
Adverse selection. When an informed trader hits your quote — say, someone buying ahead of a large institutional order — you get filled on the wrong side of a move. The more informed flow in a contract, the wider market makers need to quote to compensate.
Inventory risk. Even without informed flow, random order imbalance builds directional exposure. If a maker buys 200 contracts on the bid and only sells 150 on the offer before price moves, they're sitting on 50 lots of unwanted inventory. Managing this requires hedging in correlated instruments or widening quotes to slow down the accumulating side.
Queue position competition. On futures exchanges using price-time priority, getting to the front of the queue at the best bid or ask determines fill probability. Market makers compete aggressively for queue position — submitting orders early, maintaining them through quote updates, and managing cancellation/replacement strategies. As [@tigertrader noted on NexusFi][1], the shift from human floor traders to electronic execution at the core changed how liquidity provision works, moving from physical presence and relationships to speed and algorithmic optimization.
The net result: market makers narrow spreads and deepen the order book during normal conditions, reducing transaction costs for everyone. But they're not doing it as a public service. They're doing it because the economics work — until they don't. Together, these participants and their behavior form the backbone of auction market theory — the framework for reading any market as a continuous, price-discovering auction process.
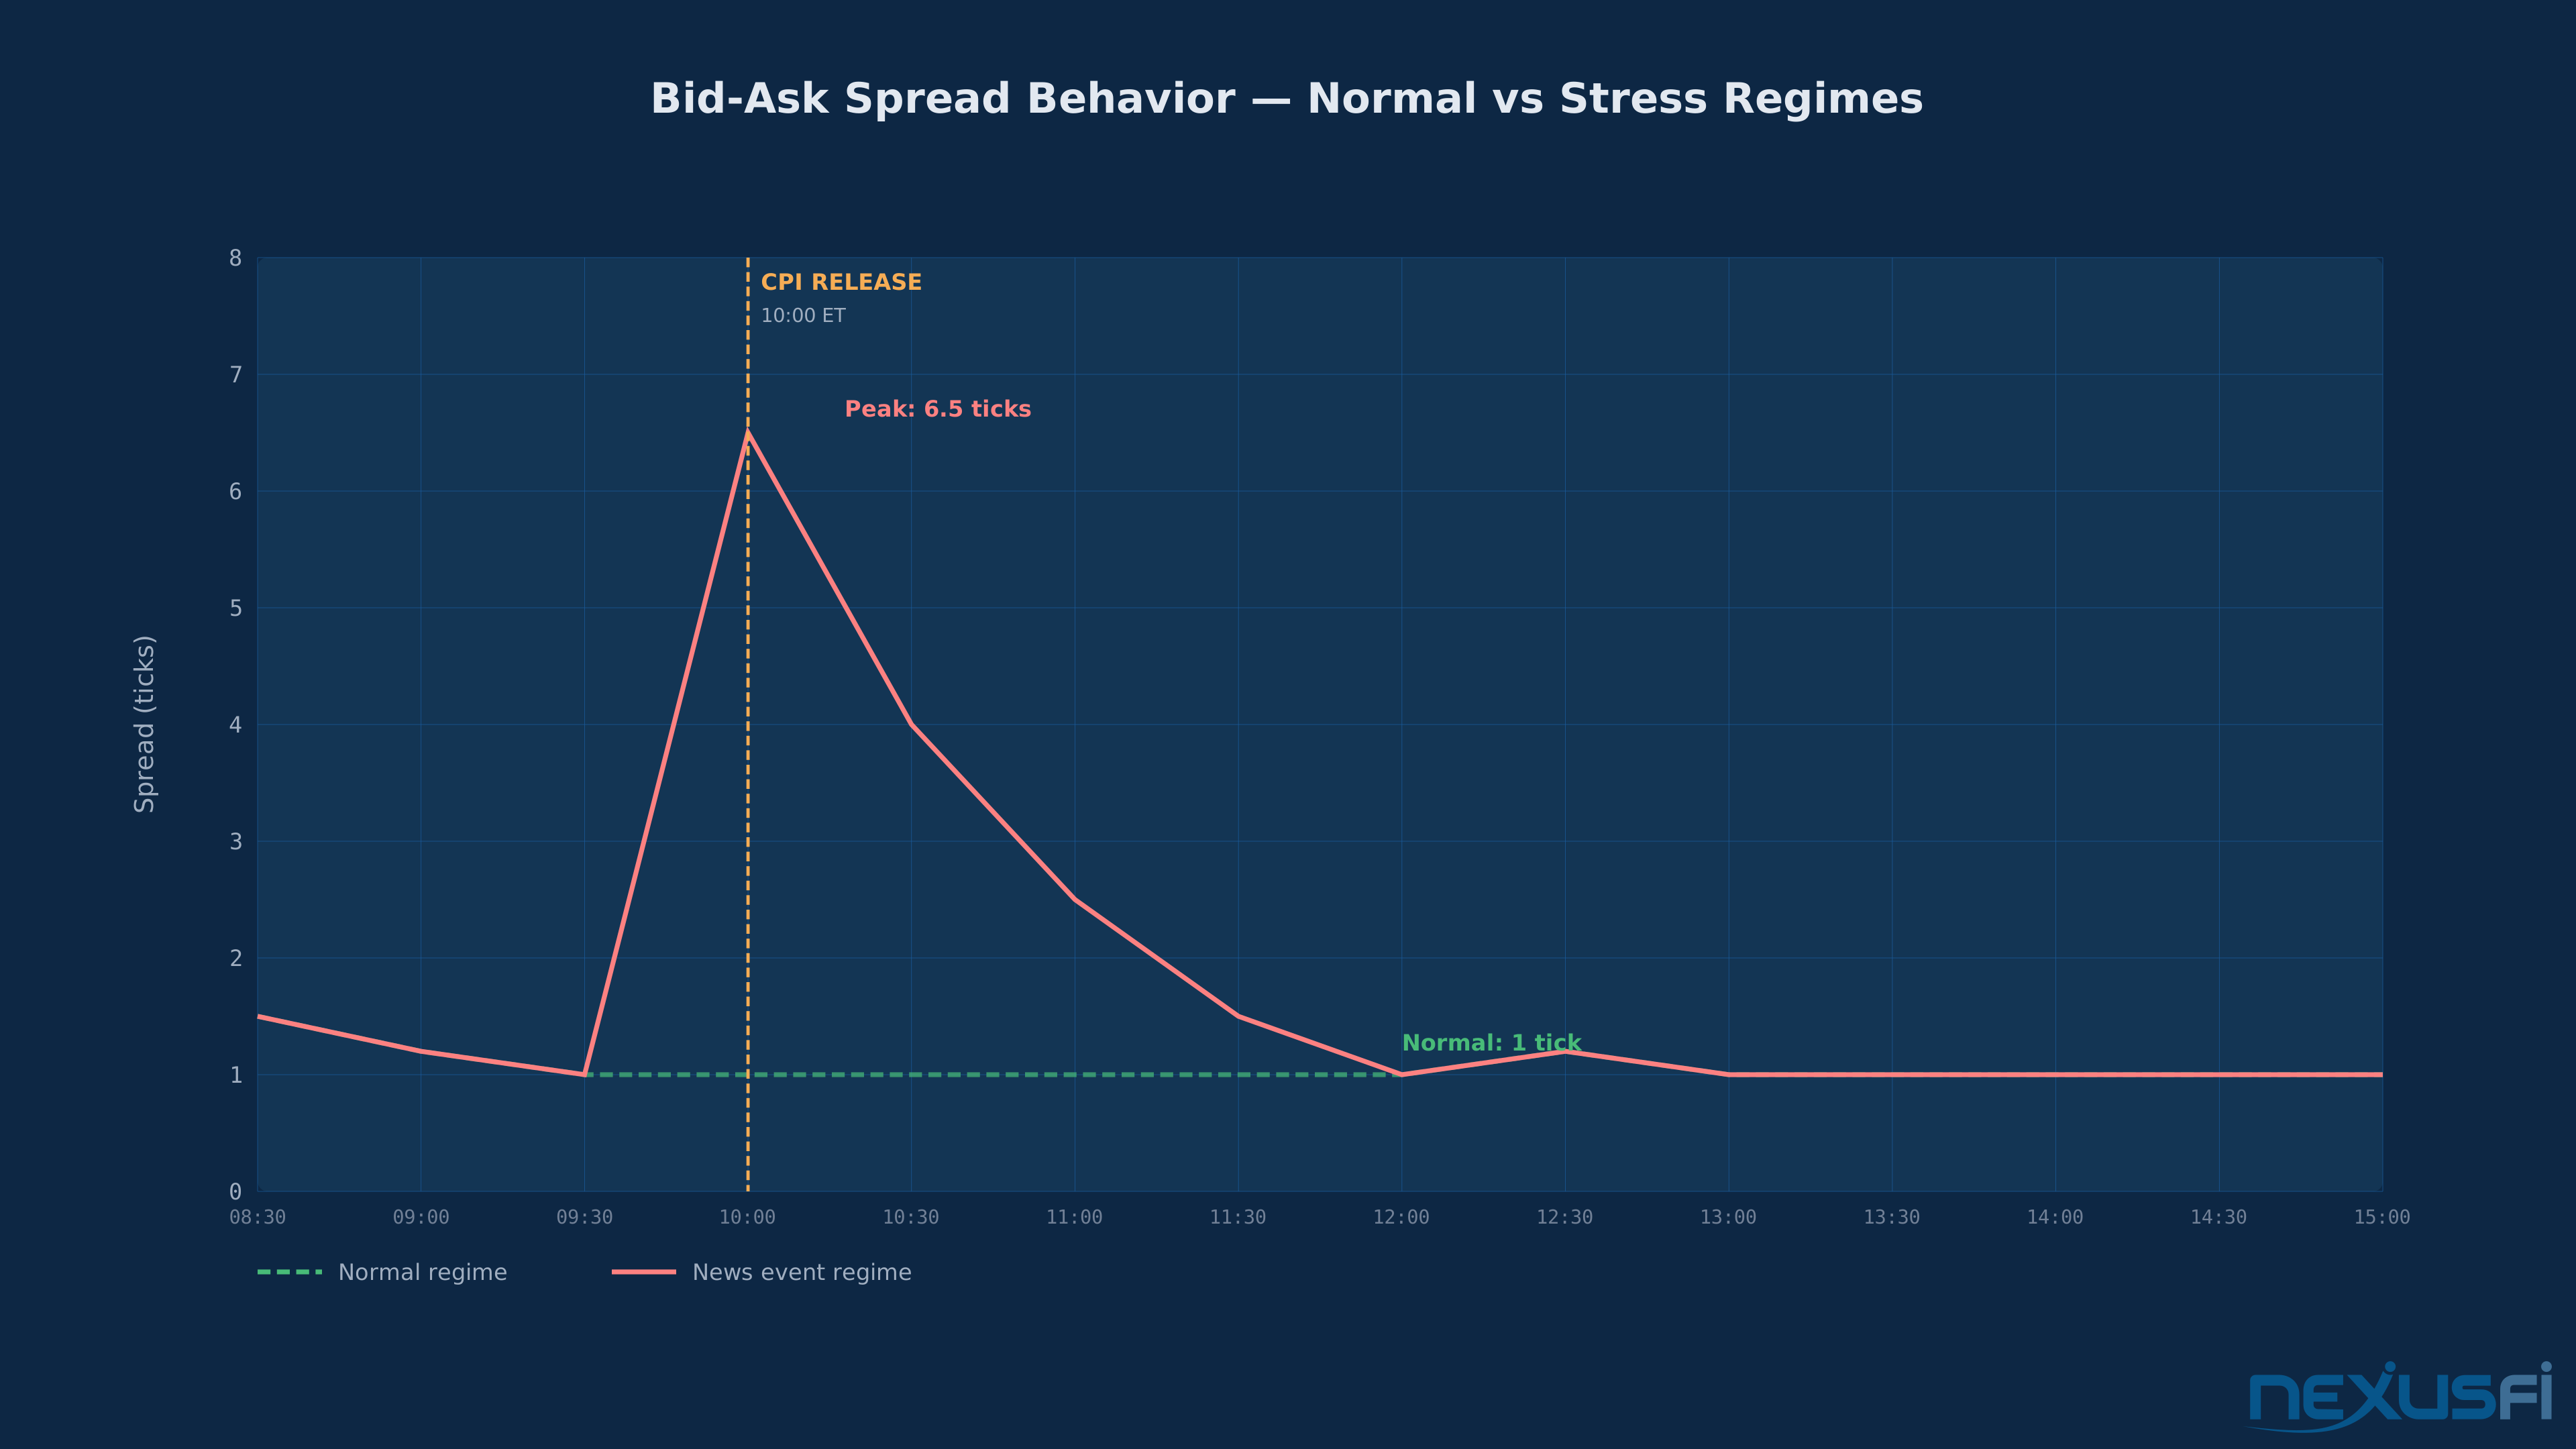
Market Makers Reduce Average Costs, Not Guaranteed Costs: They tighten the spread during calm conditions and earn the spread capture. During volatility events, they widen quotes or reduce size — the spread you're quoted at 8:29 AM before CPI isn't the spread you'll get at 8:29 AM during CPI release. Understanding liquidity in futures markets means understanding that the "average" execution quality you see in backtests doesn't reflect the regime-dependent reality of live trading.
Designated Market Makers: The Exchange-Sanctioned Liquidity Floor #
What a DMM Actually Is #
A Designated Market Maker is a firm formally recognized by a futures exchange to provide continuous, two-sided liquidity in specific contracts. The key word is "formal" — DMMs operate under explicit obligations that distinguish them from any other participant who happens to post limit orders.
The designation creates a contract between the exchange and the DMM: the exchange gets reliable liquidity (fewer dead zones, tighter quotes, deeper books), and the DMM gets economic incentives that make the obligation worthwhile. Neither side does this out of generosity.
DMM Obligations: What Exchanges Measure #
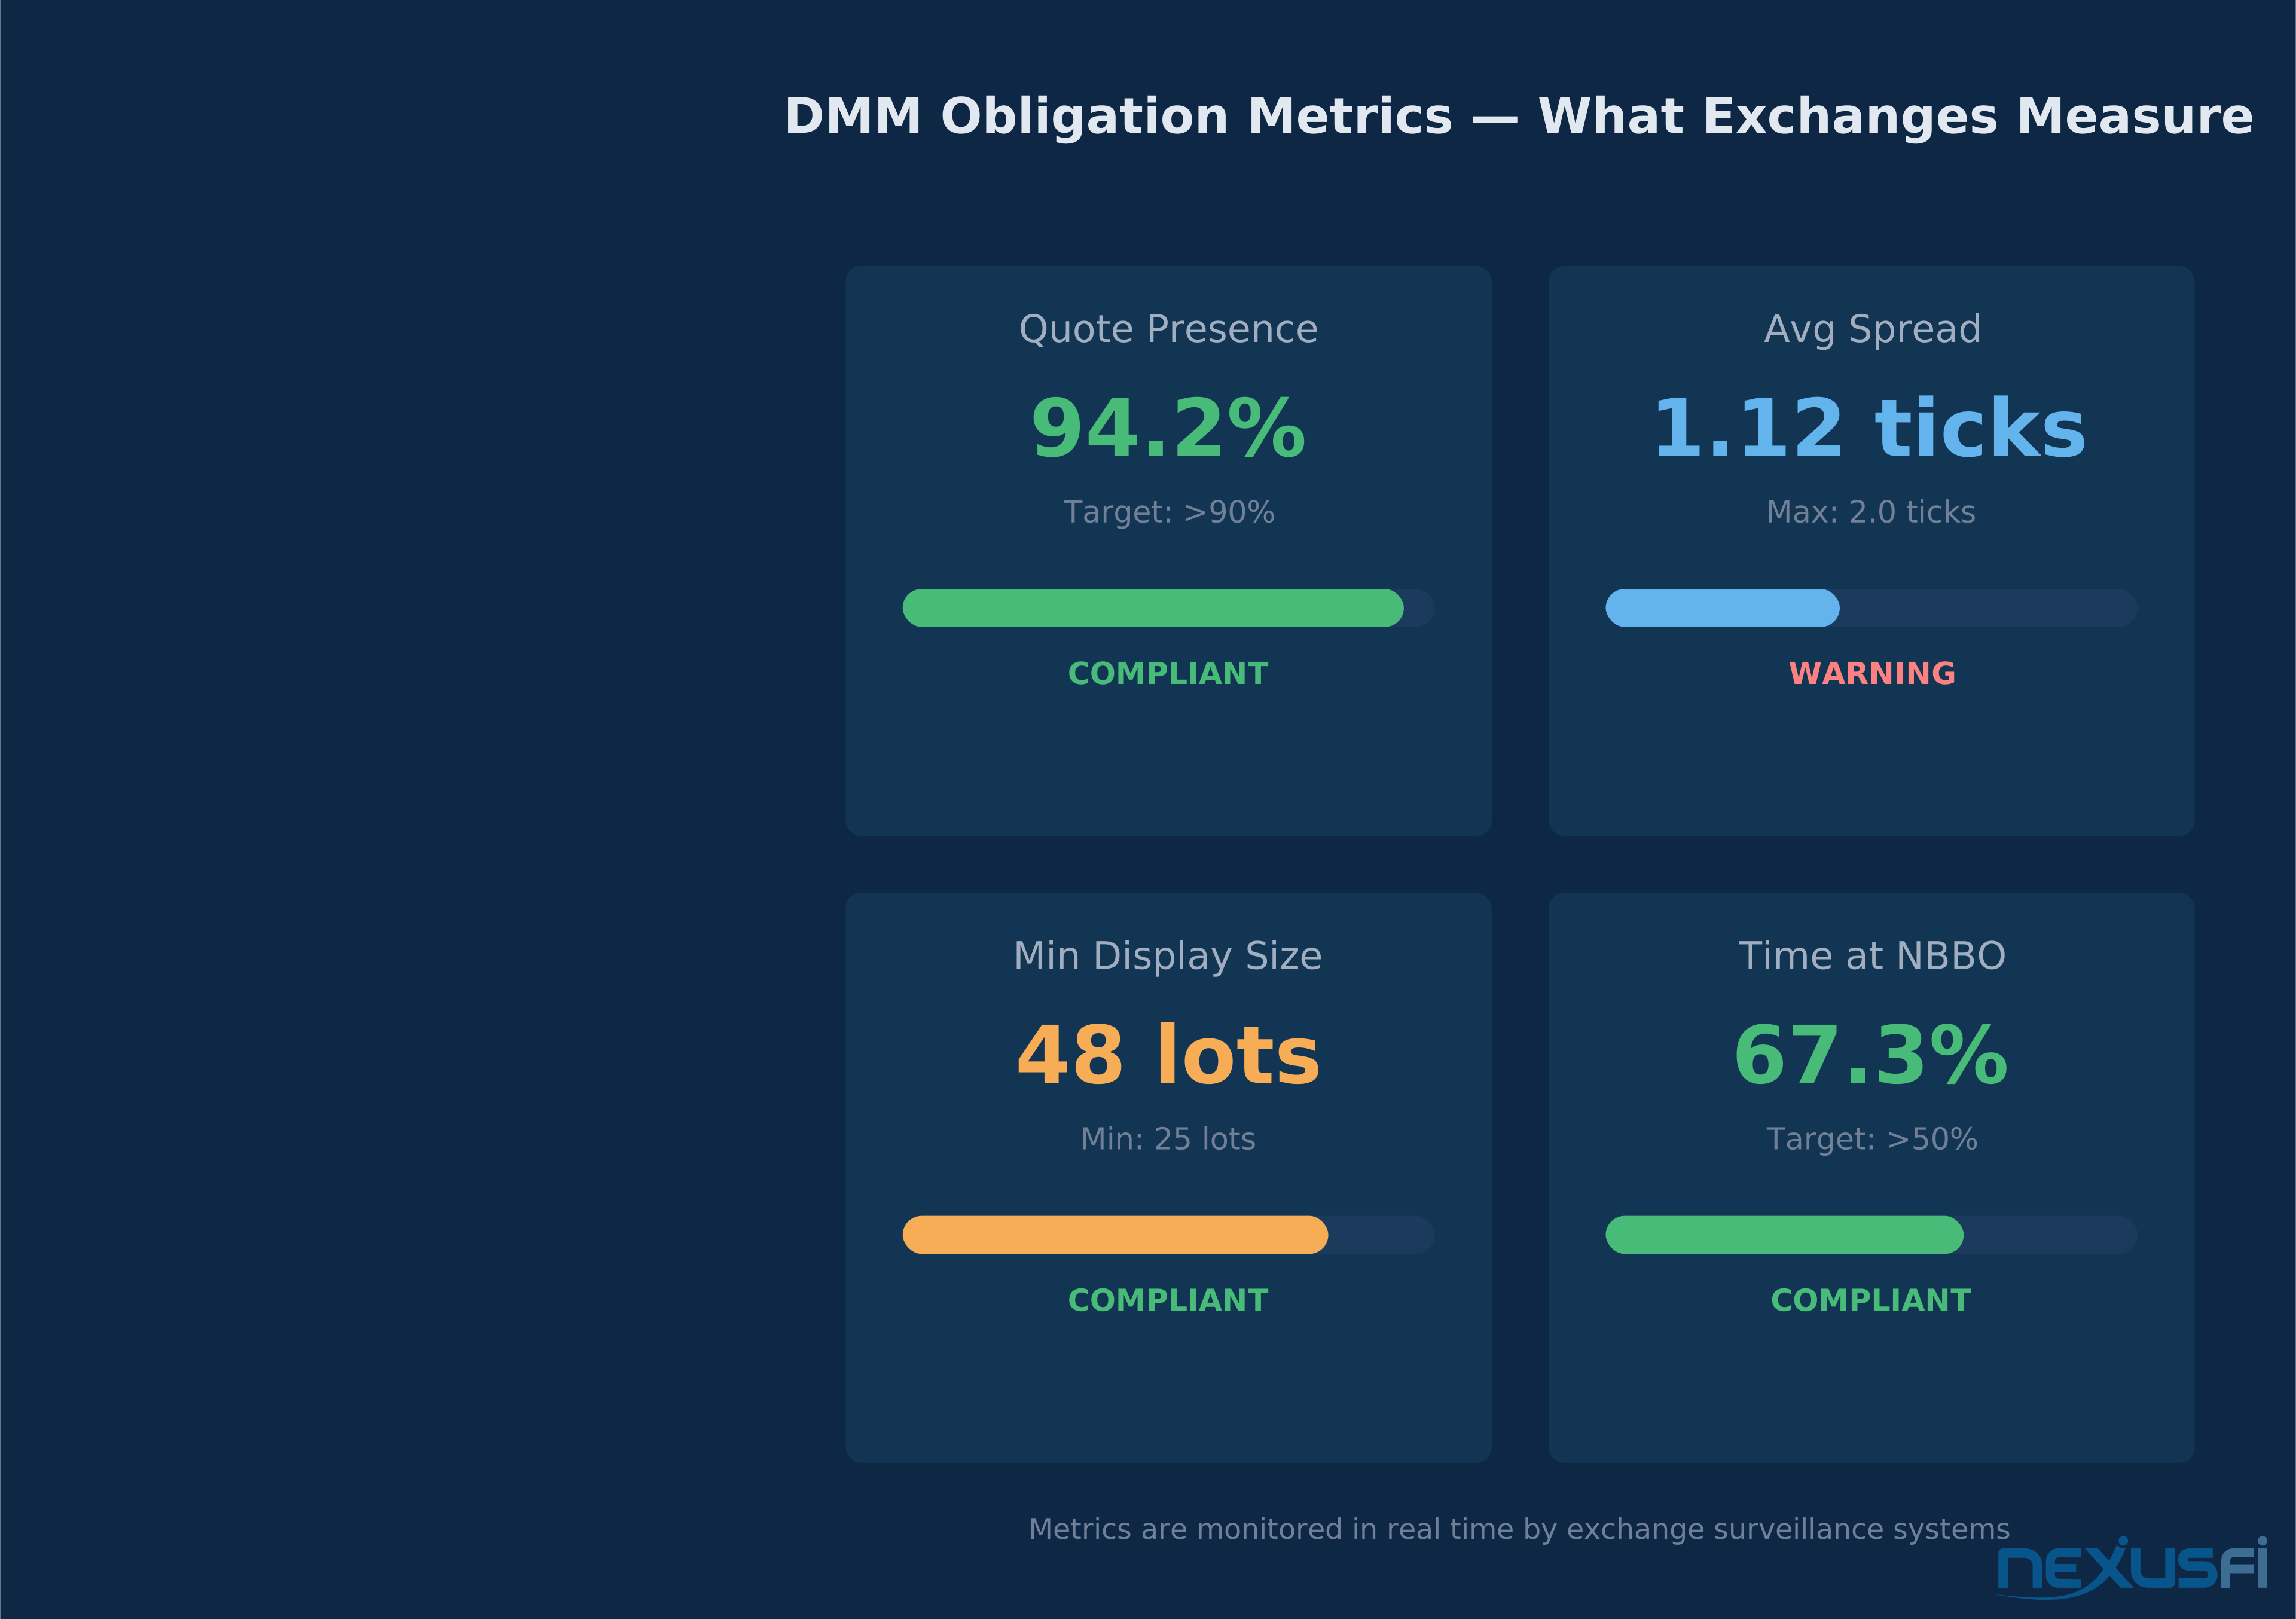
Exchange surveillance systems monitor DMM performance against specific metrics:
Quote presence. The percentage of trading time the DMM maintains valid two-sided quotes within acceptable parameters. A typical target is 90%+ of regular trading hours. Drop below the threshold, and incentive payments get reduced or designation gets reviewed.
Spread width. Maximum allowable bid-ask spread in ticks. For a liquid contract like ES, the maximum might be 2 ticks — though competitive pressure usually keeps the actual spread at 1 tick. For less liquid contracts, the allowable spread may be wider, reflecting the greater inventory risk.
Minimum display size. The minimum number of contracts that must be shown at the quoted bid and ask. This prevents DMMs from meeting the letter of their obligations with 1-lot quotes that vanish on contact.
Time at NBBO. The percentage of time the DMM's quotes are at the national best bid or offer. This measures competitiveness — not just presence, but quality of presence. Market makers thrive in balance vs imbalance conditions — when the market is in equilibrium with roughly equal buy and sell pressure, their job is straightforward and their quotes stay tight. When the market tips into imbalance — one side dominating — they face the adverse selection problem head-on and must widen or face inventory accumulation. A DMM quoting 3 ticks wide in a 1-tick market is technically present but not useful.
These metrics aren't abstract. They're calculated continuously, reported to the DMM, and tied directly to incentive payments. Miss your targets, and the economics deteriorate. Miss them badly enough, and you lose the designation.
The Economics of Market Making #
Revenue Sources #
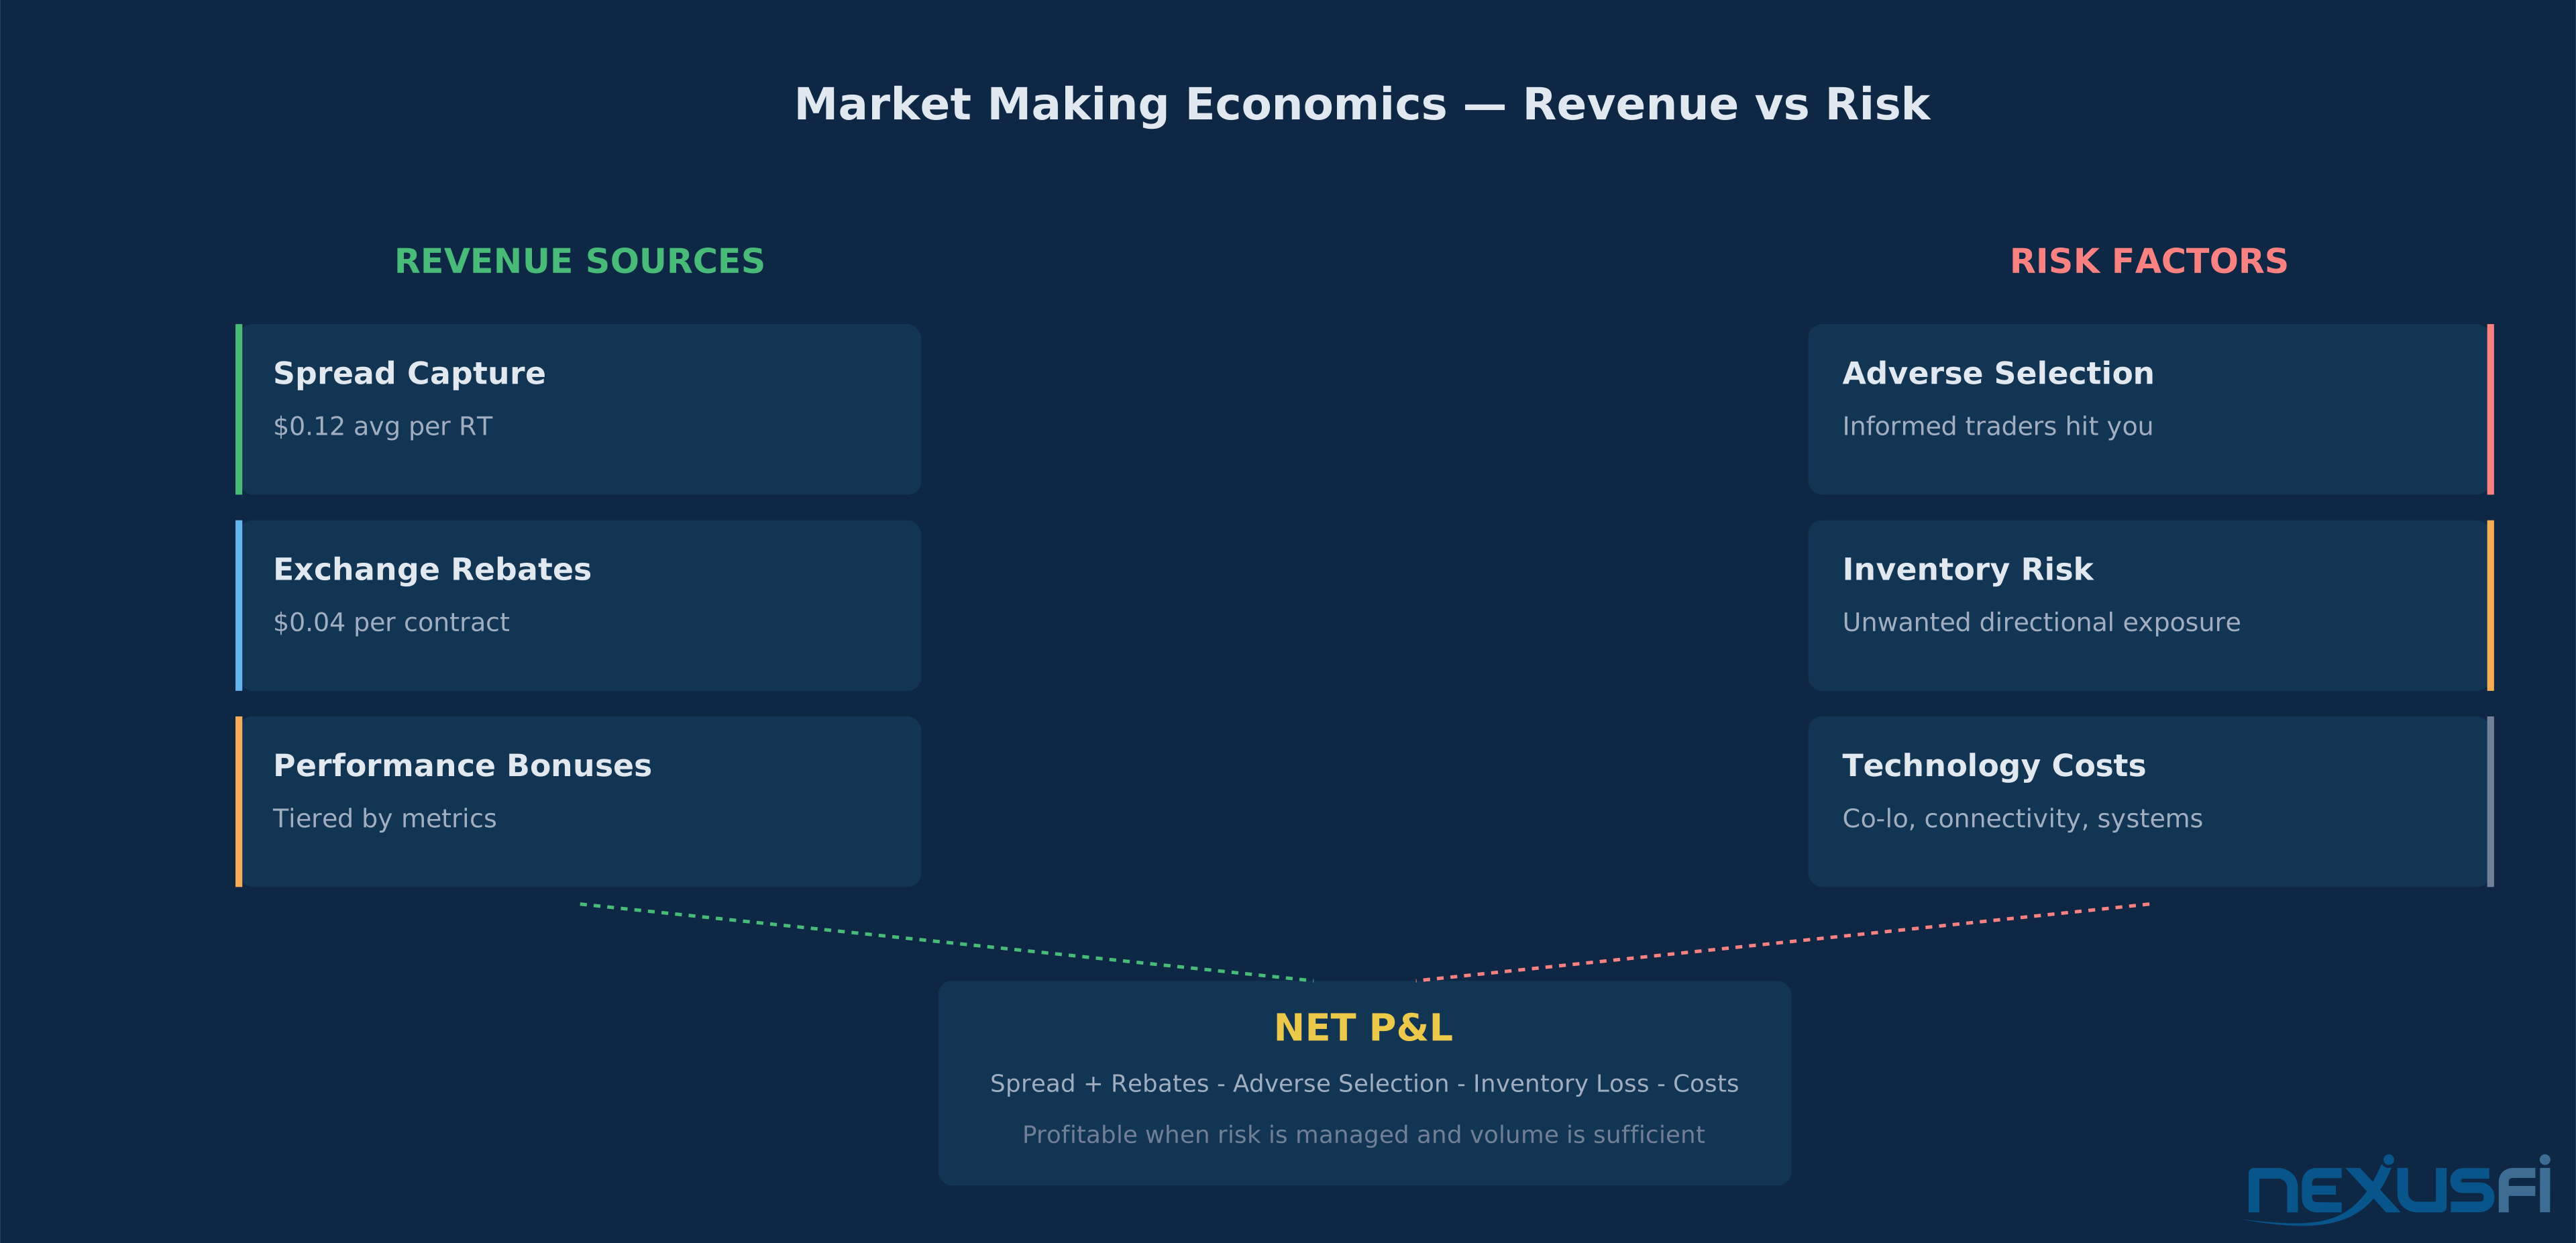
Market making revenue comes from three primary streams:
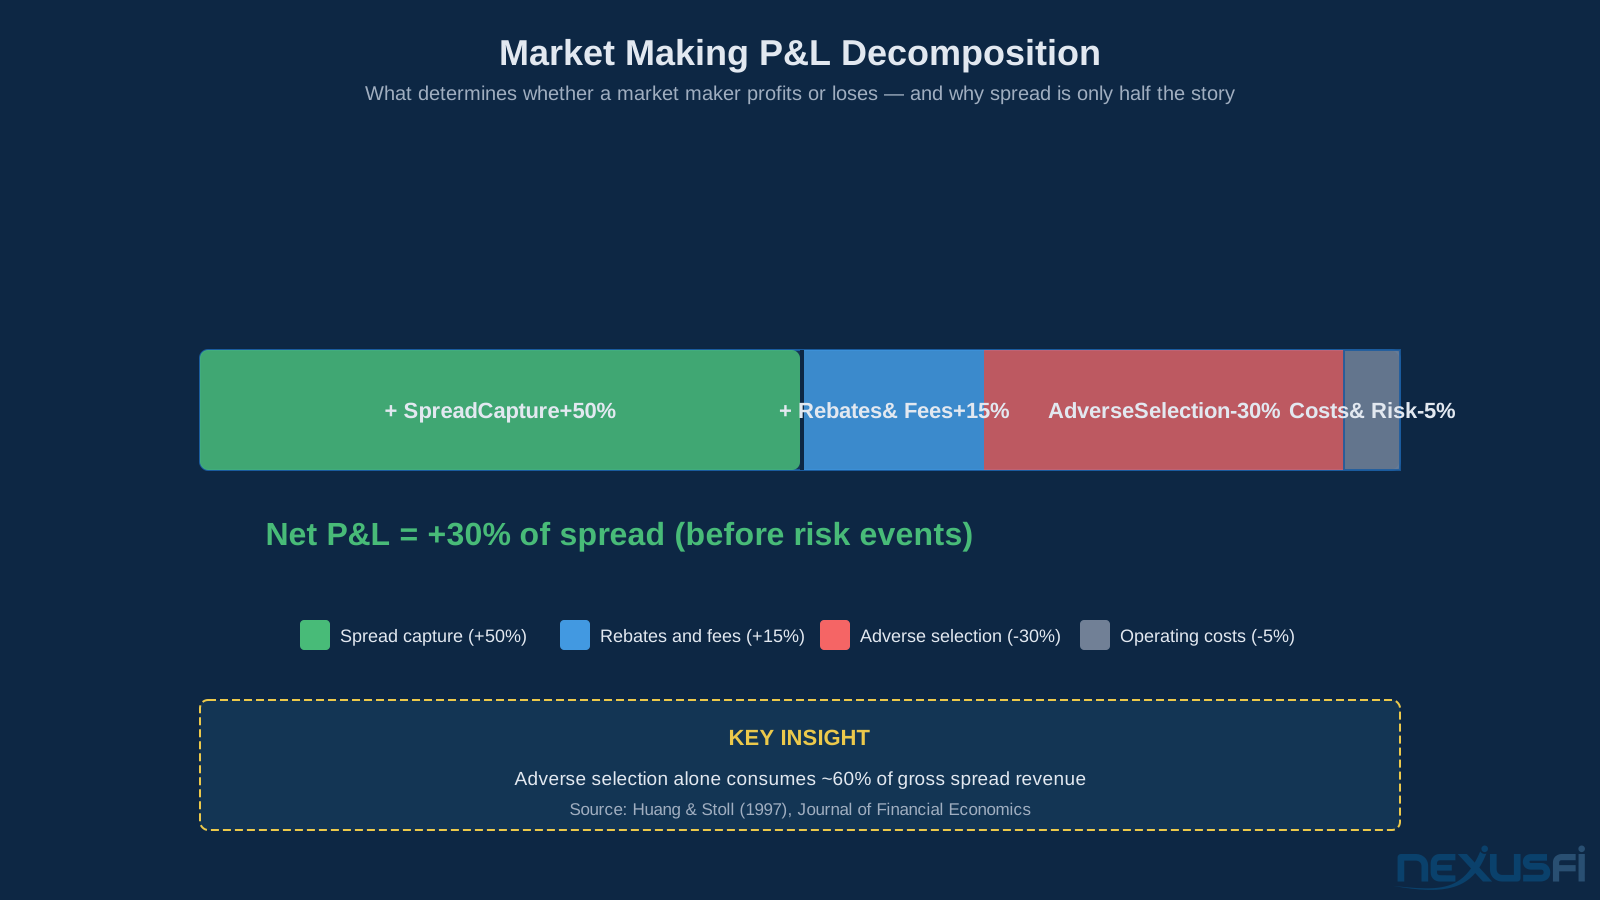
Spread capture. The core business: buying at the bid and selling at the ask. If a market maker completes 5,000 round turns per day on ES at an average spread capture of 0.5 ticks ($6.25), that's $31,250 in gross daily spread revenue. But net spread capture after adverse selection is substantially lower — a typical net might be 0.1-0.2 ticks per round turn.
Exchange rebates. Fee economics that pay the maker for providing liquidity. Standard CME fee schedules show clear maker-taker dynamics, with the maker side receiving better economics than the taker side. DMM programs amplify this advantage — designated firms receive even more favorable fee structures tied directly to their obligation performance, with additional bonuses for covering less liquid contracts where natural order flow alone wouldn't produce competitive markets.
Incentive payments. Performance-based compensation from the exchange for meeting or exceeding obligation metrics. These can represent a significant portion of DMM economics, especially in less liquid contracts where spread capture alone may not justify the risk.
Cost and Risk Factors #
Adverse selection losses. The single largest risk. When informed participants trade against your quotes, you lose more than the spread you earned. Huang & Stoll's landmark 1997 study of CME trading costs found that adverse selection accounts for roughly 60% of the bid-ask spread — the single largest component[13]. More recent simulation work by Lalor & Swishchuk (2024) confirms this dynamic in modern electronic markets, showing that adverse selection remains the primary threat to market maker profitability even with sophisticated hedging algorithms[12]. As [@iantg explained on NexusFi][2], market makers don't have any additional information advantage over retail traders — their edge comes from risk management and volume, not superior knowledge.
Inventory management. Hedging costs, margin requirements, and the P&L impact of carrying directional exposure. Even temporary inventory costs money in terms of capital tied up and hedging transactions.
Technology infrastructure. Co-location at exchange data centers, low-latency connectivity, matching engine simulation systems, and the engineering teams that maintain them. This is a fixed cost that creates barriers to entry and concentration among a relatively small number of active market makers.
Regulatory compliance. Surveillance systems, record-keeping, reporting obligations, and the compliance infrastructure required to operate as a designated participant. This overhead increases for firms operating across multiple exchanges and products.
The net result: market making is a thin-margin, high-volume business. Small changes in adverse selection rates, spread capture, or volume can swing a desk from profitable to unprofitable. This economic reality explains why market makers widen or withdraw during stress — the risk of losing more than they earn becomes too high to justify continued quoting at tight levels.
Bid-Ask Spread Mechanics #
What Determines the Spread You See #
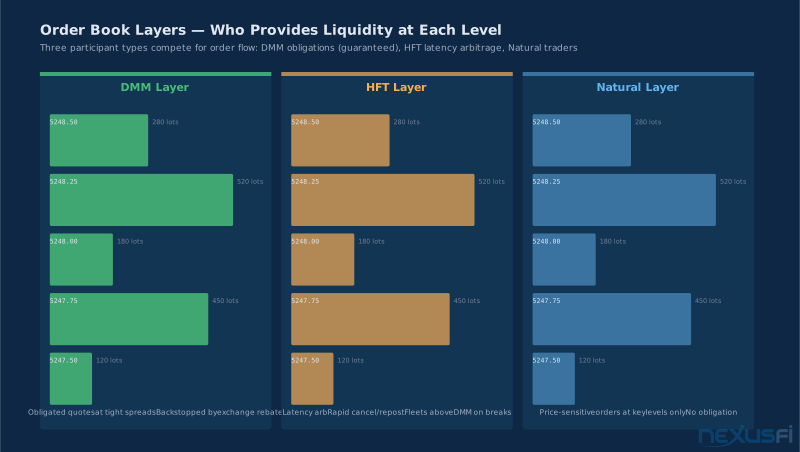
The bid-ask spread on a futures contract isn't set by any single participant. It's the emergent outcome of multiple liquidity layers competing simultaneously. To understand it fully, start with The Bid-Ask Spread as your foundation — the spread is the price of immediacy, and market makers are the ones who provide it.
The DMM/formal maker layer. Provides baseline two-sided coverage per obligations. In liquid contracts, this layer may not be the binding constraint — competitive pressure from other participants keeps the spread tighter than the DMM's maximum obligation.
The HFT/proprietary layer. Fast market makers compete aggressively at the top of book, often providing the marginal tightening that gets the spread to 1 tick. Their quoting is signal-driven: order flow imbalance, cross-contract correlation, and short-horizon volatility forecasts determine their quote placement. For more on how these firms operate in futures markets, see HFT in Futures Markets.
The natural flow layer. Hedgers, arbitrageurs, and systematic strategies that aren't market makers but still post limit orders. Their participation is event-driven and less continuous than maker quotes, but it adds depth at various price levels. For understanding how order book depth changes with this participation, see Liquidity in Futures Markets.
What Makes Spreads Widen #
The spread is a thermometer, not a thermostat. It reflects real-time risk conditions:
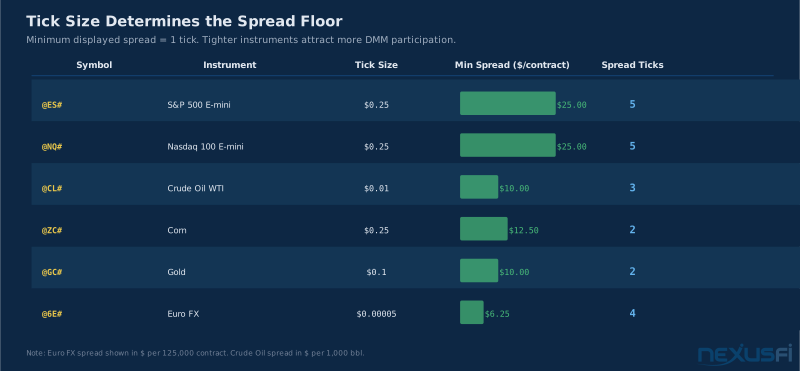
Tick size. The structural floor. On ES with a $0.25 minimum increment, the spread can never be less than 1 tick ($12.50 per contract). On contracts with coarser tick sizes, the minimum spread is proportionally wider.
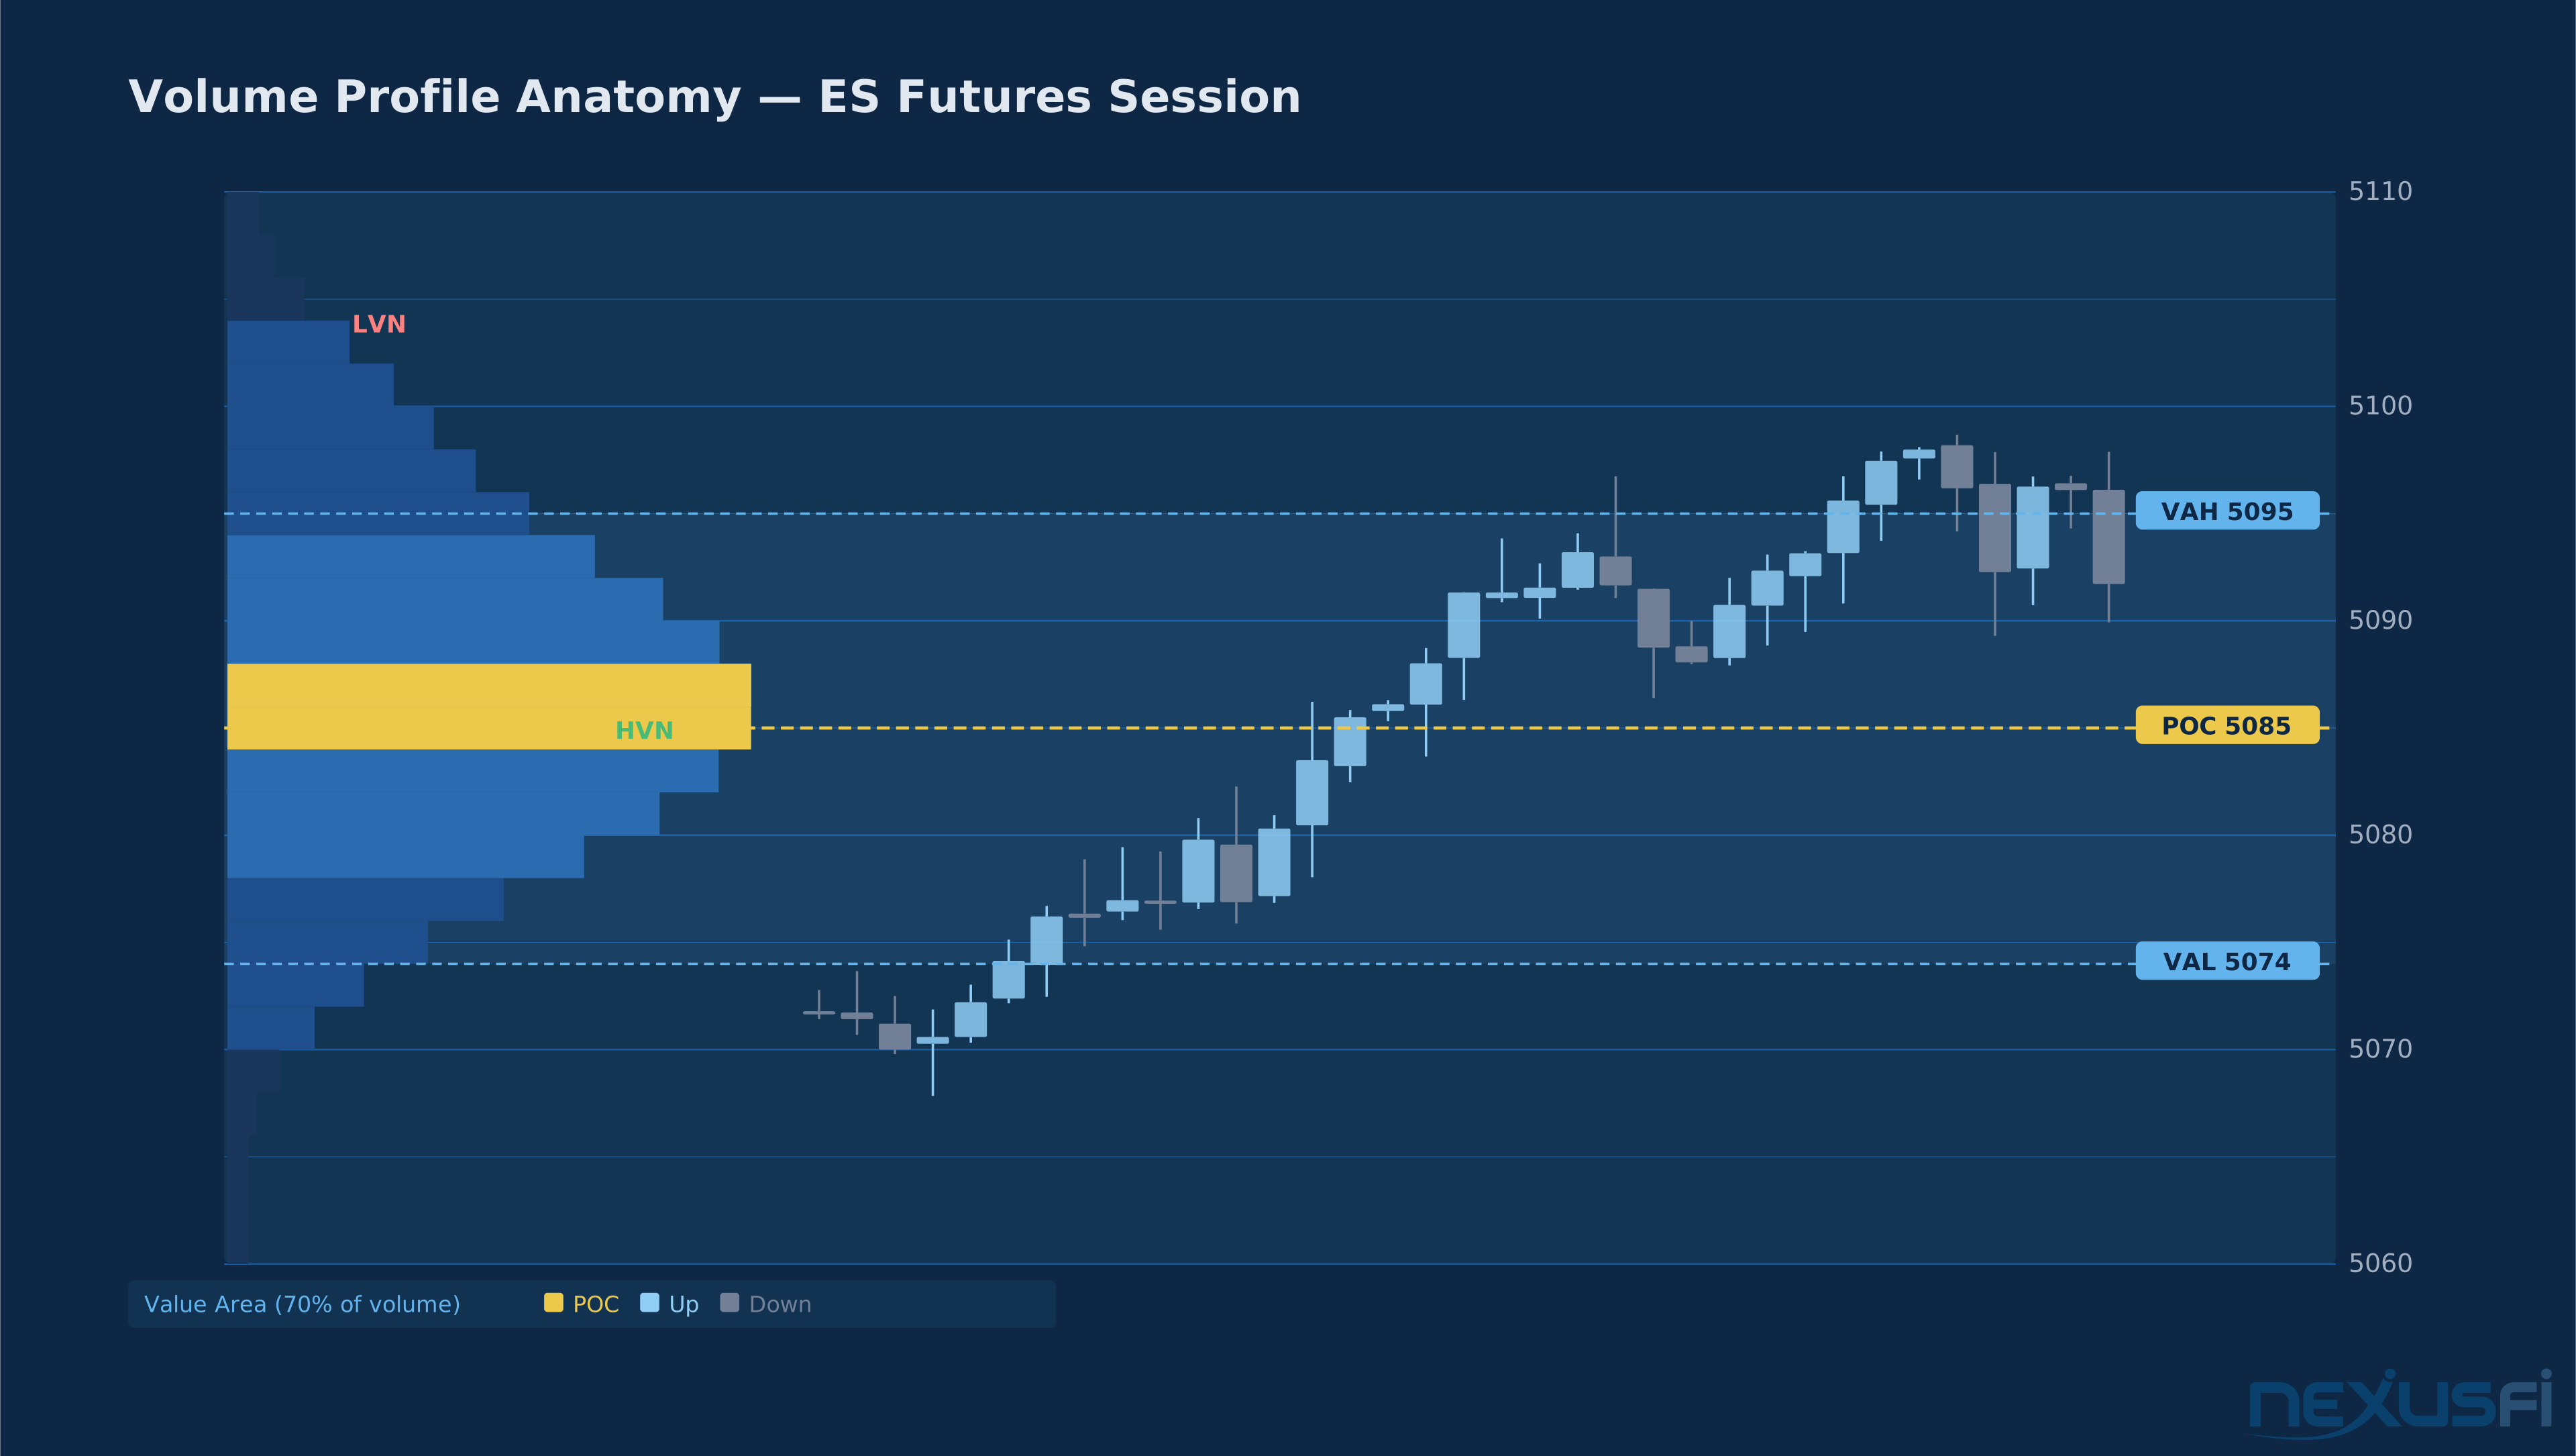
Order book imbalance. When bid-side depth erodes faster than ask-side depth (or vice versa), makers widen their quotes on the thin side to compensate for the increased adverse selection risk of being picked off. This dynamic is closely related to volume profile trading — where high-volume nodes show where institutional flow has been concentrated, and low-volume nodes mark the areas where price is most likely to seek liquidity and fair value.
Volatility regime. During CPI releases, FOMC announcements, or geopolitical events, market makers face dramatically increased uncertainty about fair value. The rational response is wider quotes and smaller displayed size — and that's exactly what happens. As [@Fat Tails documented on NexusFi][3], expected slippage is directly related to order book depth and the size of your order relative to displayed liquidity. During volatility events, both factors deteriorate simultaneously.
Inventory accumulation. If a market maker gets hit on one side repeatedly, they accumulate directional exposure. To slow down further accumulation, they widen their quote on that side or reduce displayed size. This is rational risk management, not market manipulation.
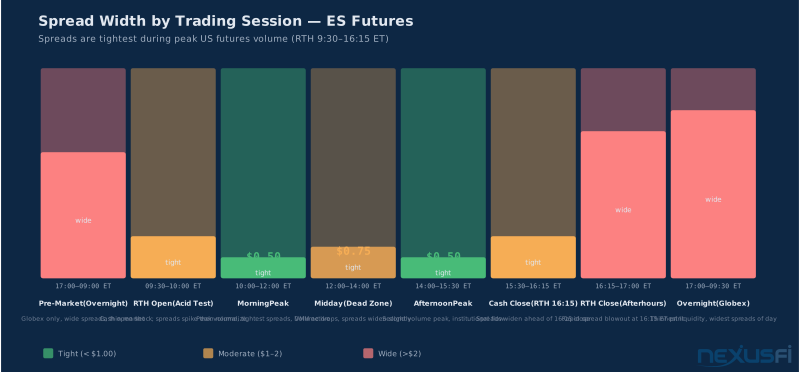
Time of day. Spreads during the US cash session (9:30 AM - 4:00 PM ET) are systematically tighter than overnight or pre-market periods. More participants means more competition for queue position, which compresses spreads.
The Liquidity Illusion #
Here's the critical concept retail traders need to internalize: the spread you see at any given moment is not the spread you'll necessarily get.
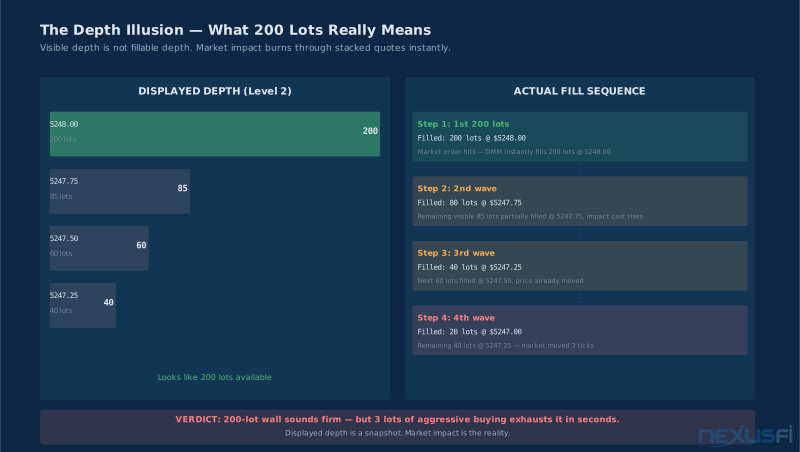
Top-of-book may show 1 tick with 300 contracts on each side. But those 300 contracts include HFT quotes that can be cancelled in microseconds, DMM quotes that may widen in response to your own order (if it signals directional intent), and natural orders that may be withdrawn during events.
Guaranteed Liquidity Is an Illusion: The 300 contracts at top-of-book include HFT quotes that can vanish in microseconds. Those quotes are technically present but operationally unreliable for any order larger than 1-lot. That's not guaranteed liquidity — it's competitive liquidity that disappears the moment conditions shift.
The practical spread — what you actually pay when you cross the book — depends on your order size, the market regime when your order hits, and how deep the book actually is behind the visible top. As [josh noted in a detailed exchange on NexusFi][4], a single order for a large number of lots gets matched all at once against all available liquidity — the exchange can't pull liquidity between your order being received and matched. But the depth behind the top matters enormously for the average fill price.
HFT Market Makers vs Designated Market Makers #
Different Models, Complementary Roles #
HFT firms and DMMs serve related but distinct functions in the order book. Understanding the difference explains a lot of the behavior retail traders observe but don't always understand.
DMMs operate under obligation. They've committed to maintaining continuous two-sided quotes meeting specific metrics. Their quoting is rule-driven: meet the presence, spread, and size thresholds to earn the incentive payments. They can widen within their allowed parameters, but they can't simply withdraw.
HFT market makers operate under strategy. They provide liquidity when the risk-reward of doing so is favorable and withdraw or widen when it isn't. Their quoting is signal-driven: order flow prediction, volatility estimation, cross-contract correlation, and microstructure edge determine their quote behavior moment to moment.
How They Interact #
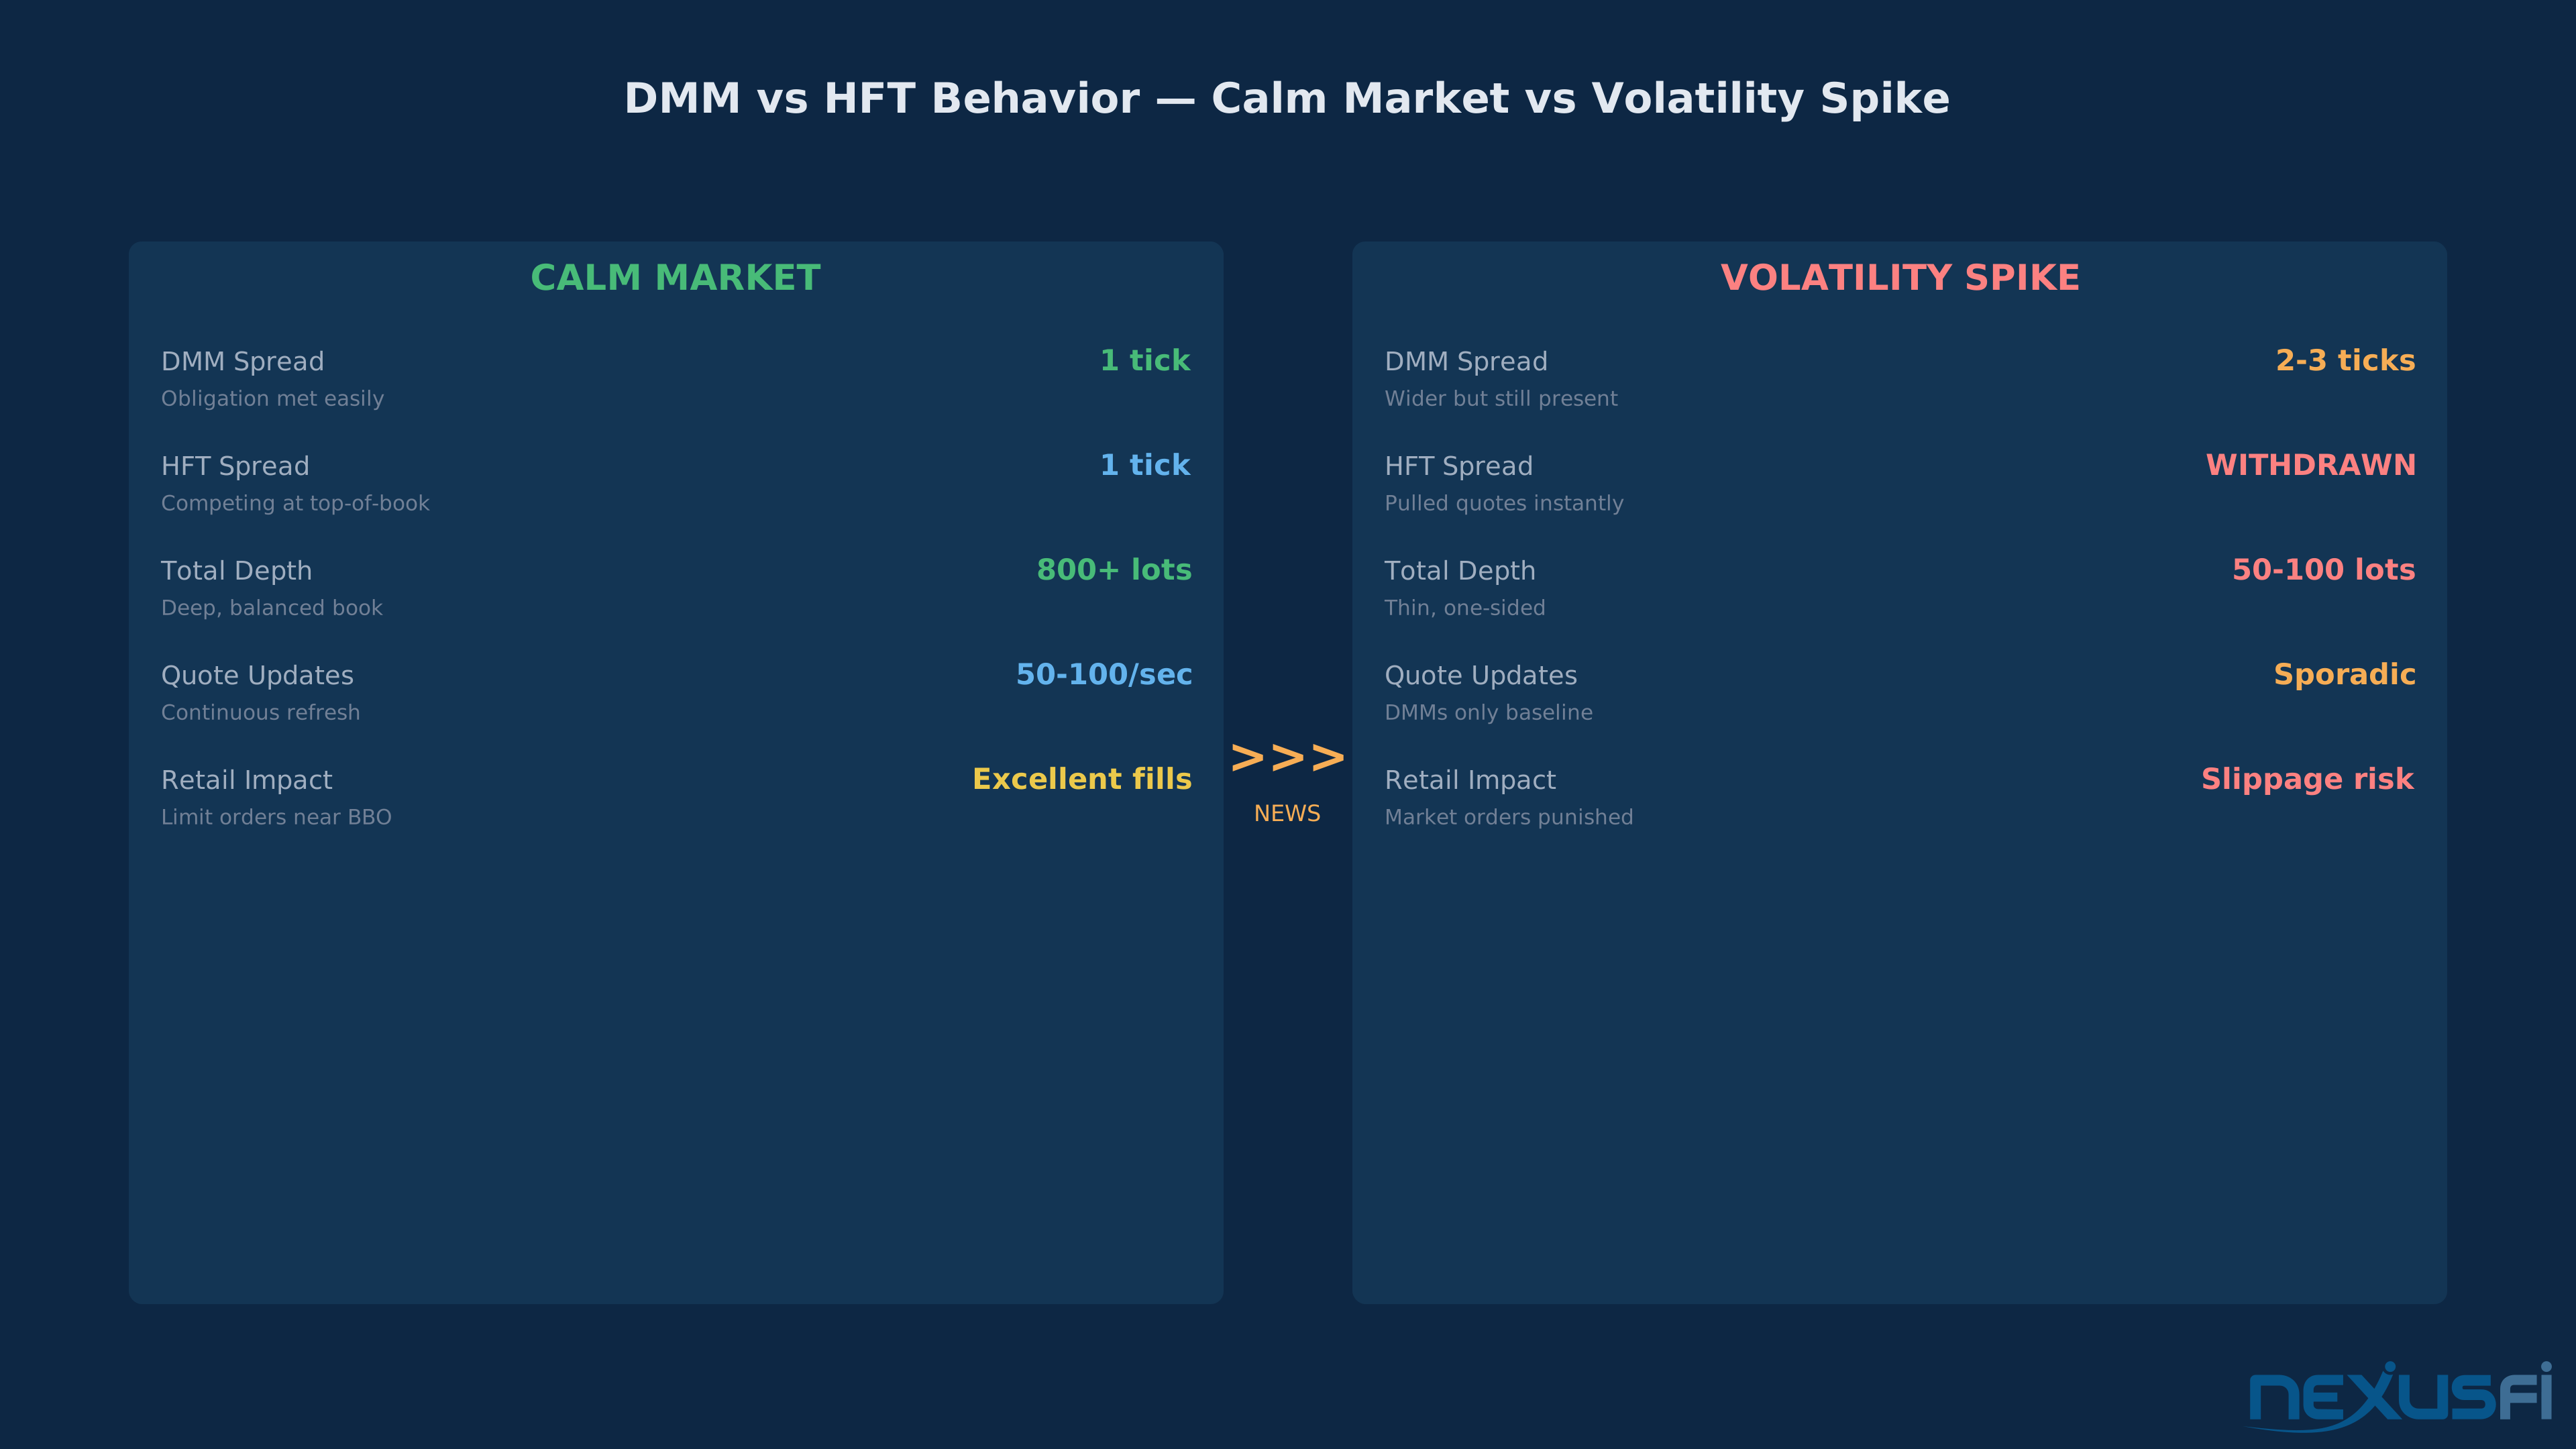
In calm markets, the distinction is nearly invisible. Both DMMs and HFT firms quote at the best bid and ask, competing for fills. The visible spread is tight (often the minimum tick), depth is significant, and quote updates are continuous. Competition between these participants is what creates the favorable execution environment retail traders enjoy.
During volatility events, the difference becomes stark:
HFT firms withdraw first. Their models detect increased adverse selection risk — volatile price action, unusual order flow patterns, or upcoming news events — and they pull their quotes or widen dramatically. This can happen in milliseconds. The [NexusFi HFT thread][5] documented this phenomenon extensively, noting that markets with the most "phantom liquidity" are sometimes dominated by participants who provide that liquidity only when conditions are favorable.
DMMs widen but stay. Their obligations require continued presence, so they widen their quotes to the maximum allowed spread and reduce displayed size to the minimum required. This provides a liquidity floor — worse than normal conditions, but not a complete vacuum.
The gap between HFT withdrawal and DMM floor creates the volatility spike that retail traders experience as "the market went crazy for 30 seconds." In reality, the permanent liquidity providers (DMMs) are still present — just at wider parameters — while the competitive liquidity (HFT) has temporarily exited.
Why This Matters for Your Trading #
The practical implication is that execution quality is regime-dependent. In calm conditions, your limit orders fill quickly and your market orders get 1-tick slippage. During events, the same orders face materially different outcomes because the liquidity environment has shifted from competitive (DMM + HFT) to baseline (DMM only).
This isn't a market failure. It's the natural consequence of how different participants manage risk. The solution for retail isn't to complain about HFT withdrawal — it's to adapt your order management to the regime you're in. For execution algorithms that help manage this regime-dependence, see Execution Algorithms for Futures Trading.
Exchange Market Maker Programs: CME and ICE #
How Programs Work in Practice #
CME and ICE both operate market maker and liquidity provider programs, though specific terms vary by product, contract, and time period. CME's E-mini equity index DMM program, formalized in a 2014 CFTC rule filing[11], established the template for how exchanges structure these relationships — explicit obligations tied to measurable incentives. What retail traders should know is how the programs function operationally — not the obligation metrics themselves (those are covered above), but how firms enter, operate within, and are monitored by these programs.
Eligibility. Firms must meet qualification standards including capital requirements, technology capabilities, regulatory standing, and often clearing member status (either directly or through an affiliate). This qualification process is significant — it means DMMs are established, regulated entities, not anonymous algorithmic operators.
Contract assignment. DMMs are designated for specific contracts or contract groups. A firm might be a DMM for ES futures but not for agricultural products. Assignment reflects the firm's expertise, capital capacity, and willingness to commit to a particular market. Traders benefit from this specialization — the ES DMM is someone who knows that contract deeply.
Compliance monitoring. Exchange surveillance systems track DMM behavior continuously. Compliance reports are generated, violations flagged, and persistent underperformance can result in reduced incentives or loss of designation. This monitoring is what gives DMM obligations teeth — they're not just promises, they're measurable and enforced.
DMM Obligations Create Subsidized Liquidity: The liquidity you see in newly launched or less liquid contracts is often economically subsidized by exchange incentive programs. Without these programs, spreads would be materially wider. Understanding this helps you assess which market conditions reflect genuine competitive liquidity vs. program-supported liquidity that might behave differently if the program changes.
You don't need to know the specific fee tiers or obligation parameters for every CME product. What you need to understand is the implication: the liquidity you see on screen is partially the result of explicit economic incentives and obligations, not just free-market competition.
This means:
- Liquidity in newly launched or less liquid contracts is often "subsidized" by DMM incentive programs. Without these programs, spreads would be materially wider and depth materially thinner.
- The baseline quality of the order book has a floor set by DMM obligations. Even when competitive HFT liquidity withdraws, the DMM floor prevents complete illiquidity.
- Program changes affect execution quality. When exchanges modify DMM programs — adjusting obligation parameters, changing incentive structures, or adding/removing contracts from coverage — it can visibly impact the trading experience. CME's 2026 implementation of a cryptocurrency futures weekend market maker program[14] illustrates how exchanges continue adapting — extending formal liquidity provision to 24/7 crypto markets where traders expect continuous access.
What Market Making Means for Retail Traders #
The Execution Quality Framework #
Market making directly determines your execution quality. Understanding the framework lets you make better decisions. For a deeper dive into the mechanics of how orders get filled and matched, see Futures Order Execution — the exchange matching process is where market maker behavior translates into your fill quality.
Execution cost = spread + depth impact + timing impact + your order type.
- Spread: The minimum cost of crossing the book. In liquid futures, usually 1 tick during normal conditions.
- Depth impact: If your order is larger than the displayed quantity at the best price, you "walk the book" and pay progressively worse prices. [As discussed in the NexusFi slippage thread][6], the average size of resting orders and your position relative to nearby price levels both determine the depth impact.
- **Timing impact: When you trade relative to liquidity cycles. The same order placed at 10:30 AM may have very different execution than at 8:29 AM. This is why understanding the initial balance — the first hour of trading that sets the day's structure — is essential for timing your execution around the periods with the tightest spreads and deepest books.
- Order type: Limit orders that rest in the book earn the spread; market orders that cross the book pay it. Different game entirely. As [josh clarified on NexusFi][4], the delay between clicking and filling means even market orders face slippage — there's no such thing as guaranteed execution at the quoted price.
Practical Execution Guidelines #
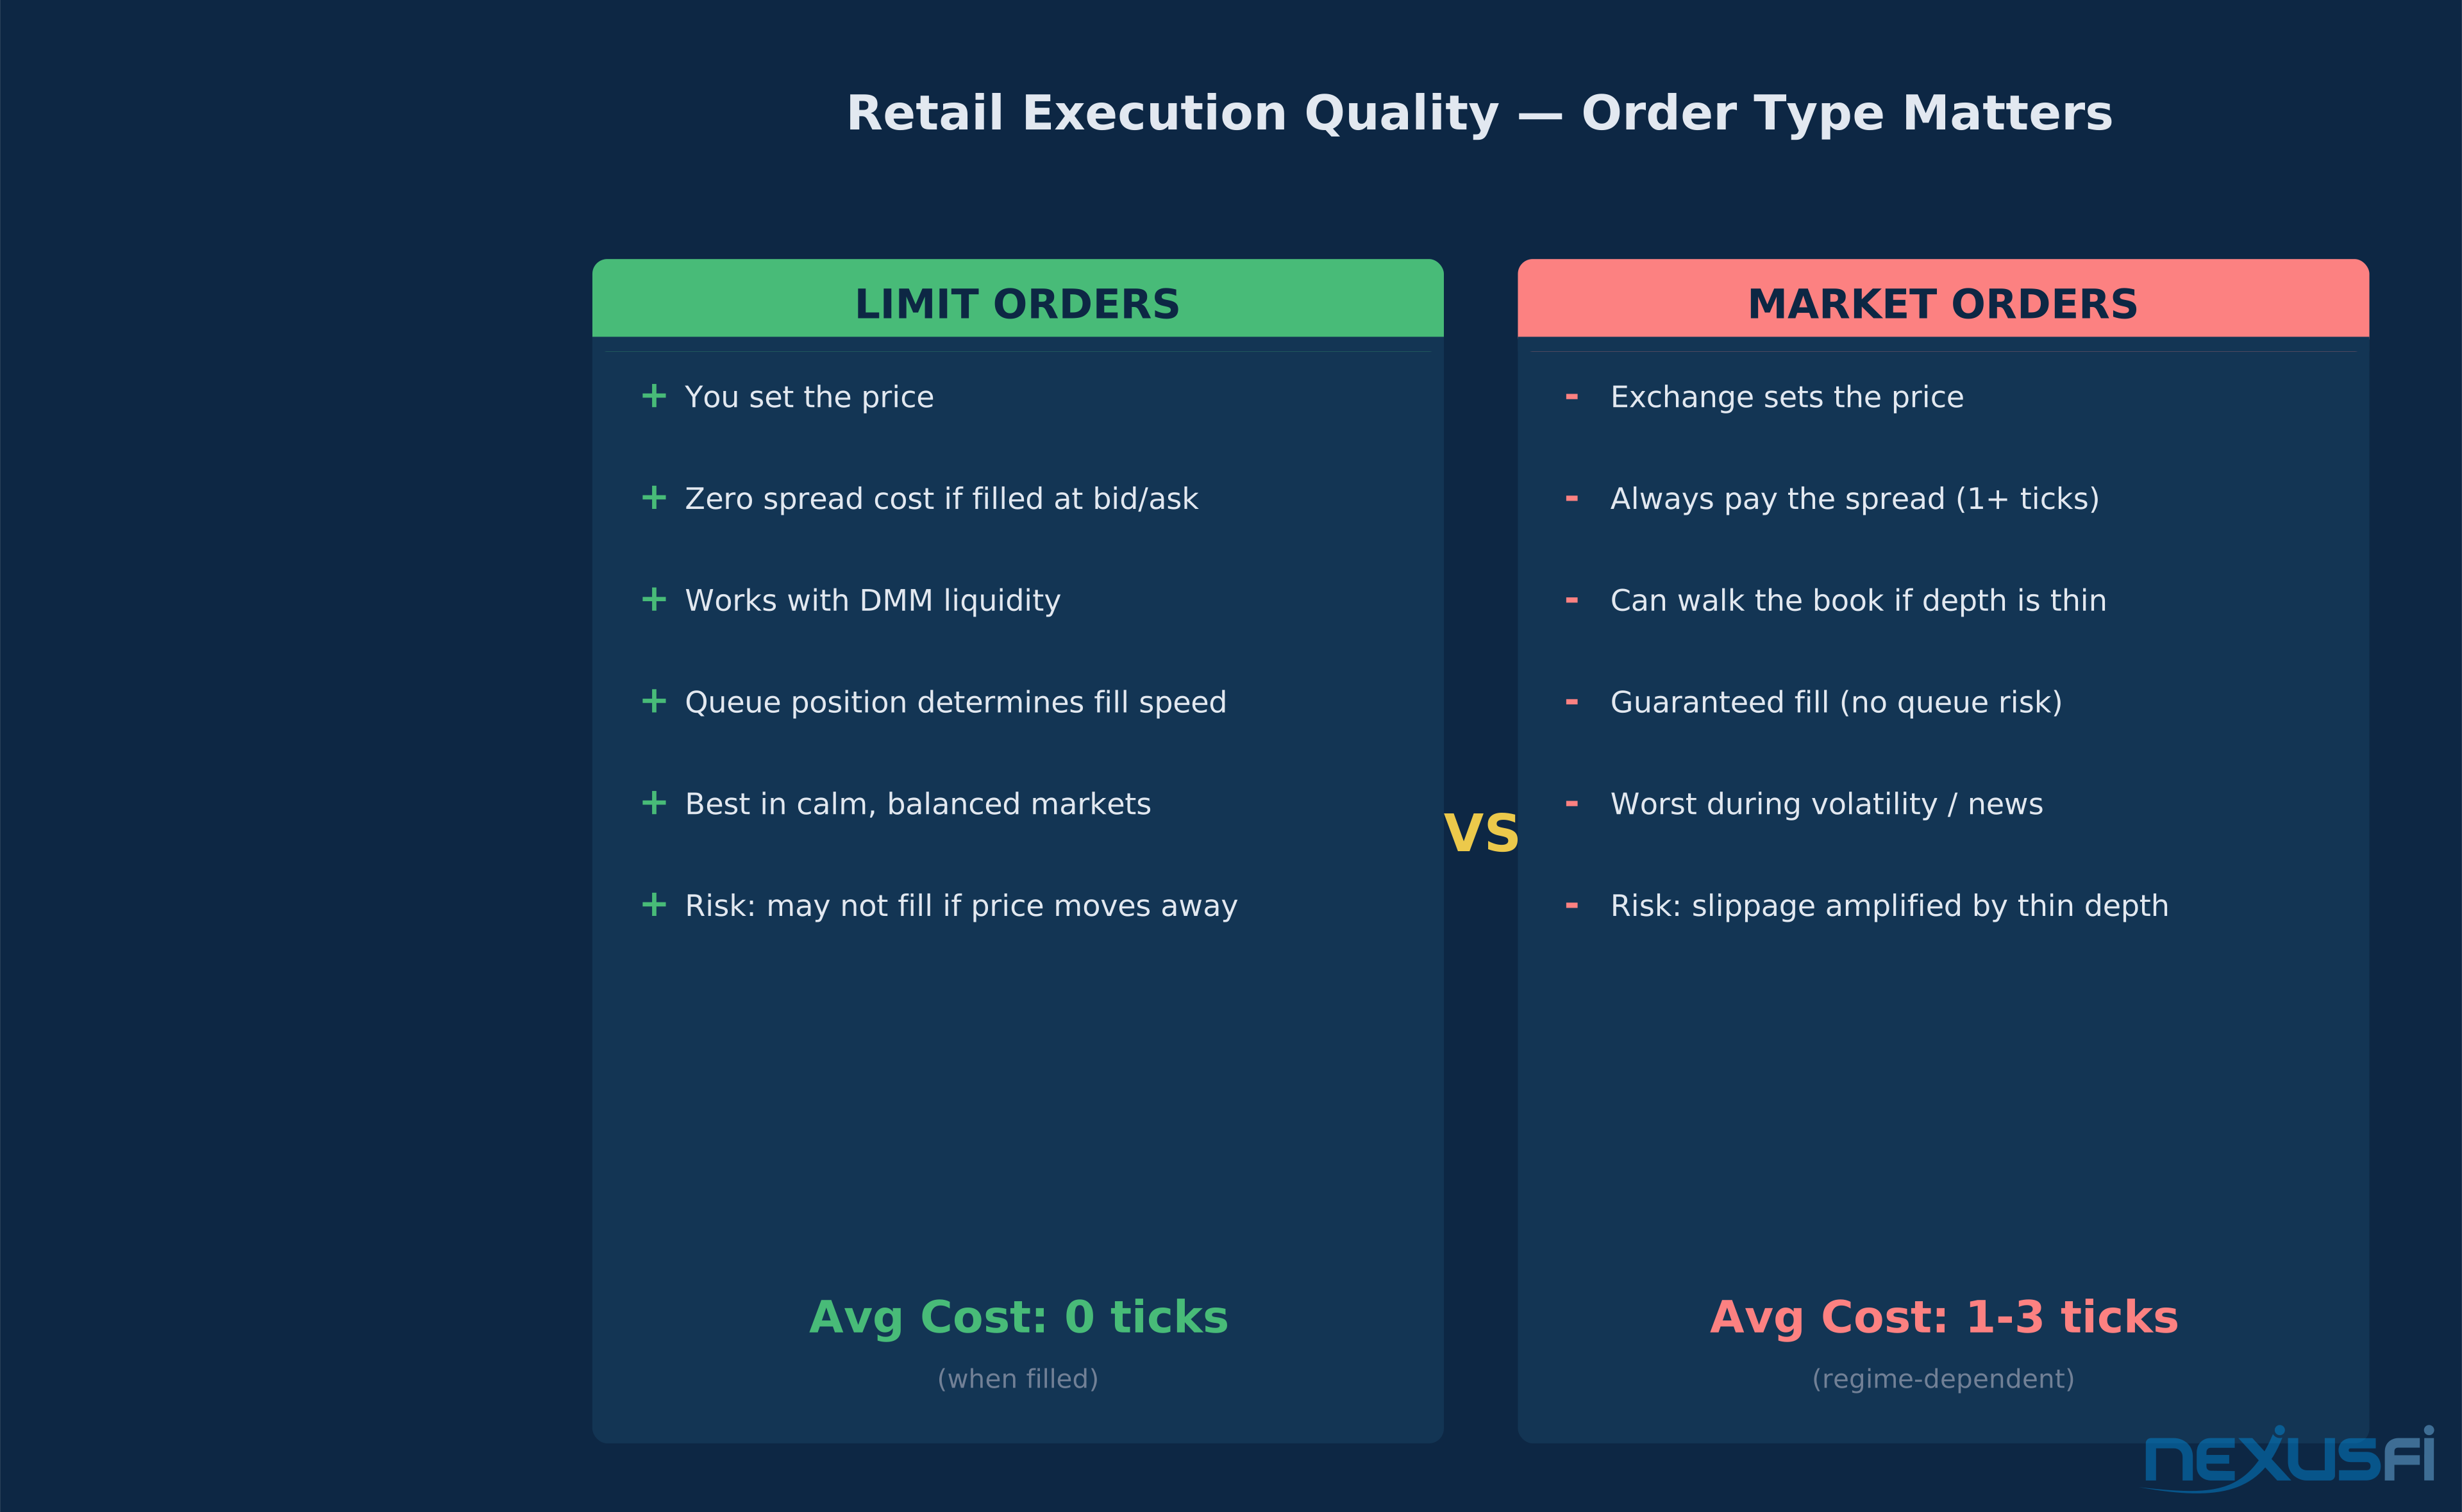
Use limit orders when spreads are tight and depth is balanced. This captures the benefits of market maker competition. Your cost is zero if filled at the best bid/ask — you're effectively acting as a liquidity provider yourself and may even earn exchange rebates in some fee structures.
Use market orders only when guaranteed execution matters more than price. If you need out of a losing position during a volatility spike, the spread you pay is the price of certainty. But using market orders routinely in calm conditions is throwing away money. As [@bobwest explained on NexusFi][7], slippage has nothing to do with your broker or trading platform — it's about the orders on the exchange and the automated matching process.
Monitor time-of-day patterns. Spreads and depth are systematically better during the most active session hours. Trading during overnight or pre-market windows means accepting wider spreads and thinner depth, which translates to higher execution costs. The active US trading session (9:30 AM - 4:00 PM ET) is when competitive pressure from both DMMs and HFT firms is highest.
Size your orders relative to displayed depth. If top-of-book shows 200 contracts and you're trading 5, your depth impact is negligible. If you're trading 50, you should consider whether the visible depth is genuinely available or includes "phantom" quotes that will be pulled before your order reaches them. [kevinkdog's analysis of slippage in 2023][8] showed that retail traders routinely underestimate how much order size relative to displayed depth drives their effective execution cost.
Be cautious around scheduled events. FOMC, CPI, NFP, and other macro releases trigger predictable liquidity withdrawal. If you need to trade during these windows, use limit orders with wider buffers and expect slippage on any market orders. The spread is going to widen — plan for it rather than being surprised by it.
Track your own realized execution. Exchange-wide averages don't tell you what you're paying. Record your fills, compare them to the prevailing bid/ask at the time of order submission, and calculate your personal effective spread. Patterns will emerge: certain times of day, certain order sizes, and certain market conditions systematically produce better or worse fills. That's actionable data.
Pro Tip — Track Your Own Execution: Record every fill with: timestamp, instrument, order type, quantity, limit price, fill price, and prevailing bid/ask at submission. Then calculate your effective spread: (fill price minus mid-price at submission) divided by tick value, times 2. For a market buy filled at 5245.25 when the bid/ask was 5245.00/5245.25, your effective spread was 0.5 ticks, not 1. After 100+ fills, you'll see patterns specific to your trading windows, order sizes, and the contracts you trade most. That's data you can't get from any platform's default analytics.
The Misconception to Shed #
The most damaging retail misconception about market making: "If there are market makers, I'll always get good fills."
Market Makers Reduce Average Trading Costs — Not Guaranteed Costs: They do not guarantee tight spreads during extreme volatility, zero slippage on aggressive orders, or unlimited depth at all times. Their quoting is endogenous to risk conditions — when uncertainty rises, they widen or withdraw just like any rational risk-taker.
The presence of market makers means the order book is almost always tradeable. It doesn't mean it's always cheap to trade. Understanding the difference is what separates traders who manage execution costs effectively from those who don't.
The Bottom Line #
Market making on futures exchanges is an institutional-scale risk management business that happens to benefit retail traders as a side effect. DMMs provide a contractual floor of liquidity. HFT firms provide competitive tightening on top of that floor. Natural flow adds event-driven depth. Together, these layers create the order book you see on your screen.
But that order book is dynamic. It tightens during calm conditions when competition is high and risk is low. It widens during events when uncertainty makes quoting expensive. And it can gap when all three layers simultaneously reduce their participation.
Your job as a retail trader isn't to understand every detail of DMM obligation parameters or HFT queue strategies. Your job is to understand that the liquidity environment is regime-dependent and to adapt your execution so. Limit orders in calm markets, caution during events, attention to depth beyond top-of-book, and honest tracking of your own fill quality. That's the framework.
The spread is a thermometer. Learn to read it, and you'll trade more intelligently in every market condition.
Knowledge Map
References This Article
Articles that build on this topicCitations
- — Spoo-nalysis ES e-mini futures S&P 500 (2012) 👍 7
- — Market Maker playbook wanted! (2018) 👍 7
- — Expected slippage vs order size (2010) 👍 8
- — Limit and Market order mechanics (2024) 👍 9
- — HFT High Frequency Trading (2016) 👍 11
- — Experience with Slippage/Delay on ES S&P 500 as you increase contracts? (2016) 👍 5
- — Ninjatrader Brokerage and Slippage (2022) 👍 5
- — Slippage Now 2023 vs Past (2023) 👍 6
- — Spreads brokers? (2019) 👍 7
- — Filling Limit Orders on the ES (2012) 👍 5
- Christopher Bowen, CME/CBOT — CME/CBOT E-mini Equity Index Futures Market Maker Program (2014)
- Lalor & Swishchuk, University of Calgary — Market Simulation under Adverse Selection (2024)
- Huang & Stoll — The Components of the Bid-Ask Spread: A Study of the CME (1997)
- Maureen Guilfoile, CME Group — Implementation of the Cryptocurrency Futures 24/7 Weekend Market Maker Program (2026)