



10-Year Treasury Note (ZN) Futures: The Complete Trading Guide
Overview #
The 10-Year Treasury Note futures contract — ticker ZN on CME/CBOT — is the world's benchmark interest rate instrument. When the financial press says "the 10-year yield rose 5 basis points today," they're watching what ZN is doing. Every mortgage rate, every corporate bond spread, every asset valuation model in the developed world anchors to the 10-year yield. Understanding ZN isn't just learning a futures contract — it's learning the rate that prices everything else.
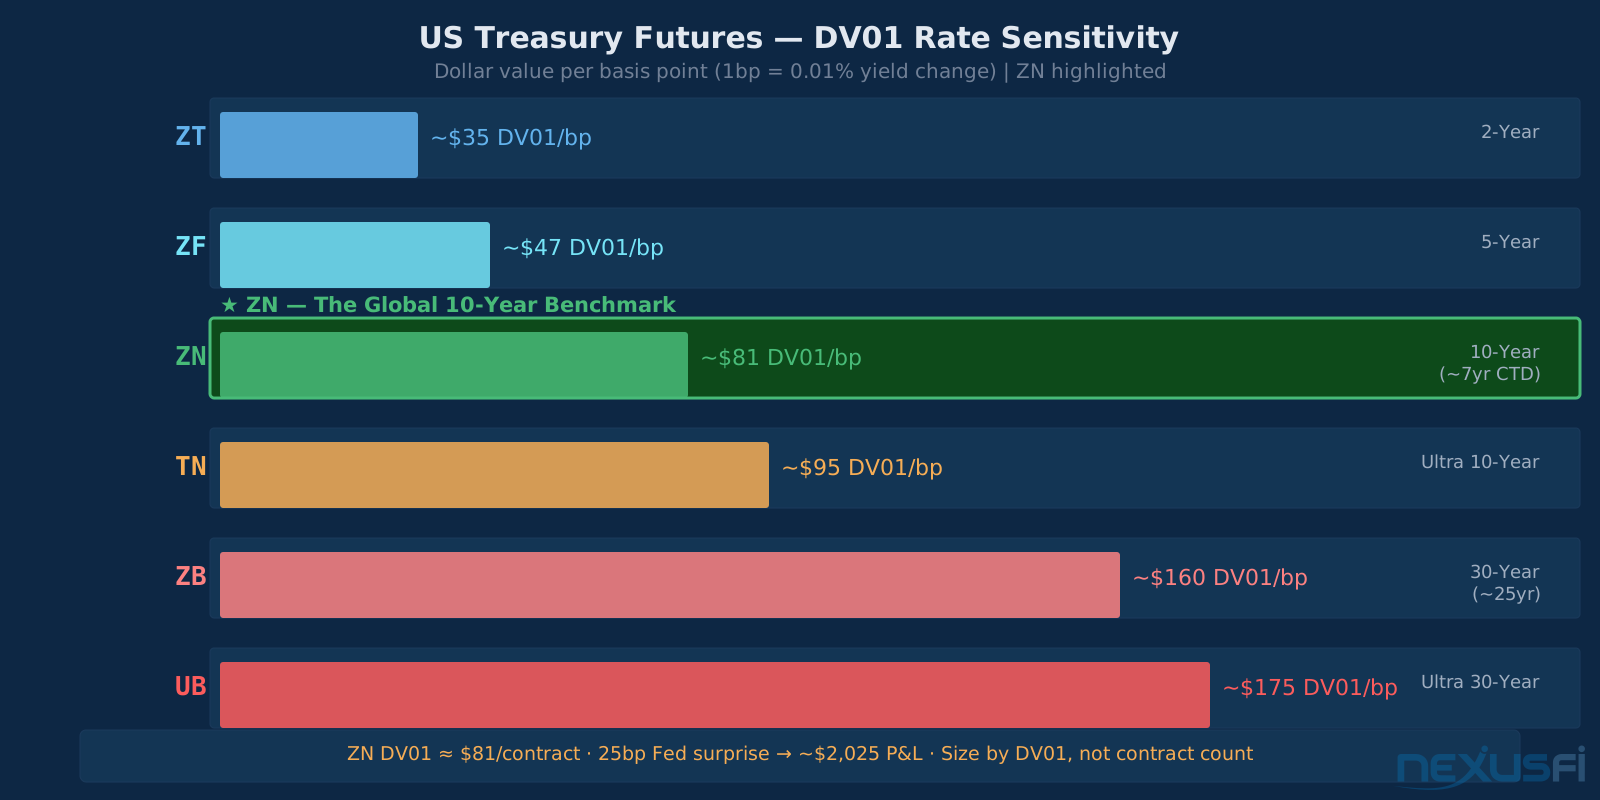
ZN is the most actively traded fixed income futures contract globally by open interest. Daily volume frequently exceeds two million contracts. The underlying $100,000 face value of US Treasury notes with maturities between 6 years 6 months and 10 years makes each contract represent roughly $81 of DV01 (dollar value per basis point) — substantially more rate sensitivity than the ZF (5-Year (ZF) ($47.50 DV01)) but less than the ZB ($160 DV01). This middle position in the curve makes ZN the default instrument for directional rate trades, yield curve spreads, and macro hedging strategies.
There's one critical nuance every ZN trader needs to internalize: because of how Treasury futures delivery works, ZN behaves more like a 7-year note than a 10-year note. The broad eligibility window for deliverable securities (6.5 to 10 years) means the cheapest-to-deliver (CTD) bond is frequently a note with 7 to 8 years remaining maturity, not 10. If you want pure 10-year exposure, the TN Ultra 10-Year Note futures contract (ticker TN) was designed specifically for that — but ZN's liquidity advantage over TN is significant. Knowing when to use ZN versus TN is part of serious fixed income trading.
Key Concepts #
DV01 (Dollar Value of a Basis Point): The dollar change in a futures contract's value when yields move by one basis point (0.01%). ZN carries approximately $80-90 DV01 depending on the current CTD bond. At this level, a 25bp surprise from the Fed costs roughly $2,000 per contract. DV01 is how you size positions, construct spreads, and calculate actual risk — never think in "points," always in basis points.
CTD (Cheapest to Deliver): Treasury futures allow a basket of eligible bonds to be delivered. The party short the futures contract chooses which eligible bond to deliver, and they'll always deliver the bond that minimizes their cost — the cheapest to deliver. ZN's CTD tends to be 7-8 year notes, which is why the contract behaves like a 7-year, not a true 10-year.
TN Ultra 10-Year Note: CME's 2016 addition to the Treasury complex. Deliverable range: 9 years 5 months to 10 years. By design, TN's CTD is always a true 10-year note. More duration-accurate, less liquid than ZN. When precision matters more than execution cost, use TN.
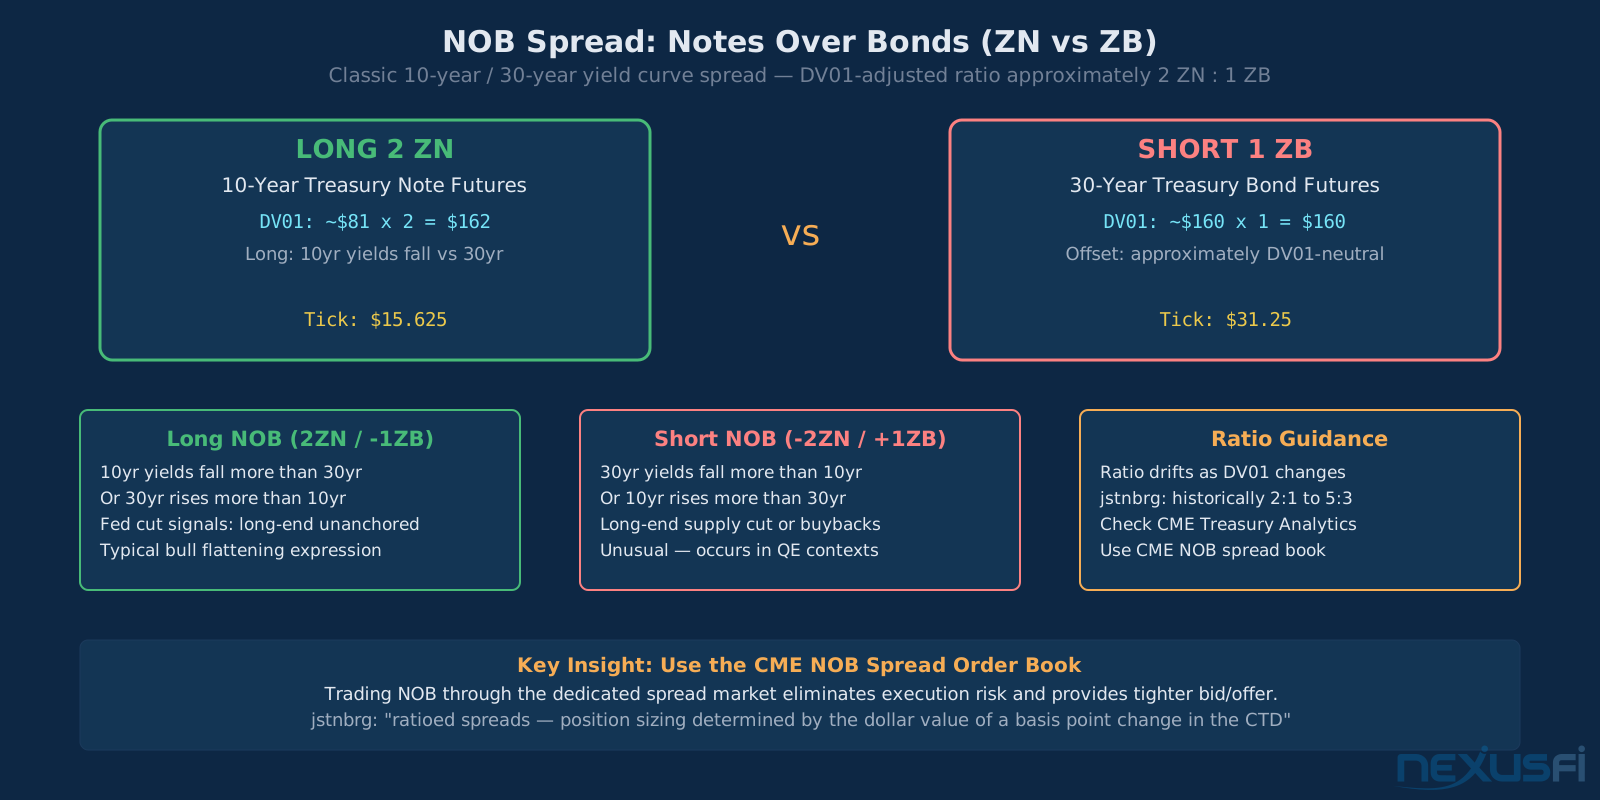
NOB Spread (Notes Over Bonds): The classic ZN vs. ZB curve trade. Long NOB = long ZN, short ZB = expecting the 10-30 spread to steepen (10-year yields fall relative to 30-year). The DV01-adjusted ratio is roughly 2:1 (2 ZN per 1 ZB).
FITE Spread (Five-Year/Ten-Year): ZF vs. ZN curve trade. Ratio approximately 3 ZF per 2 ZN (DV01-neutral). The belly-to-belly expression for the 5-10 year slope.
Yield Curve: The graphical representation of yields across Treasury maturities. ZN sits at the 10-year point — close enough to the long end to carry meaningful inflation expectations, close enough to the short end to capture Fed policy sentiment over 2-4 year horizons. It's the hinge of the curve.
Contract Specifications #
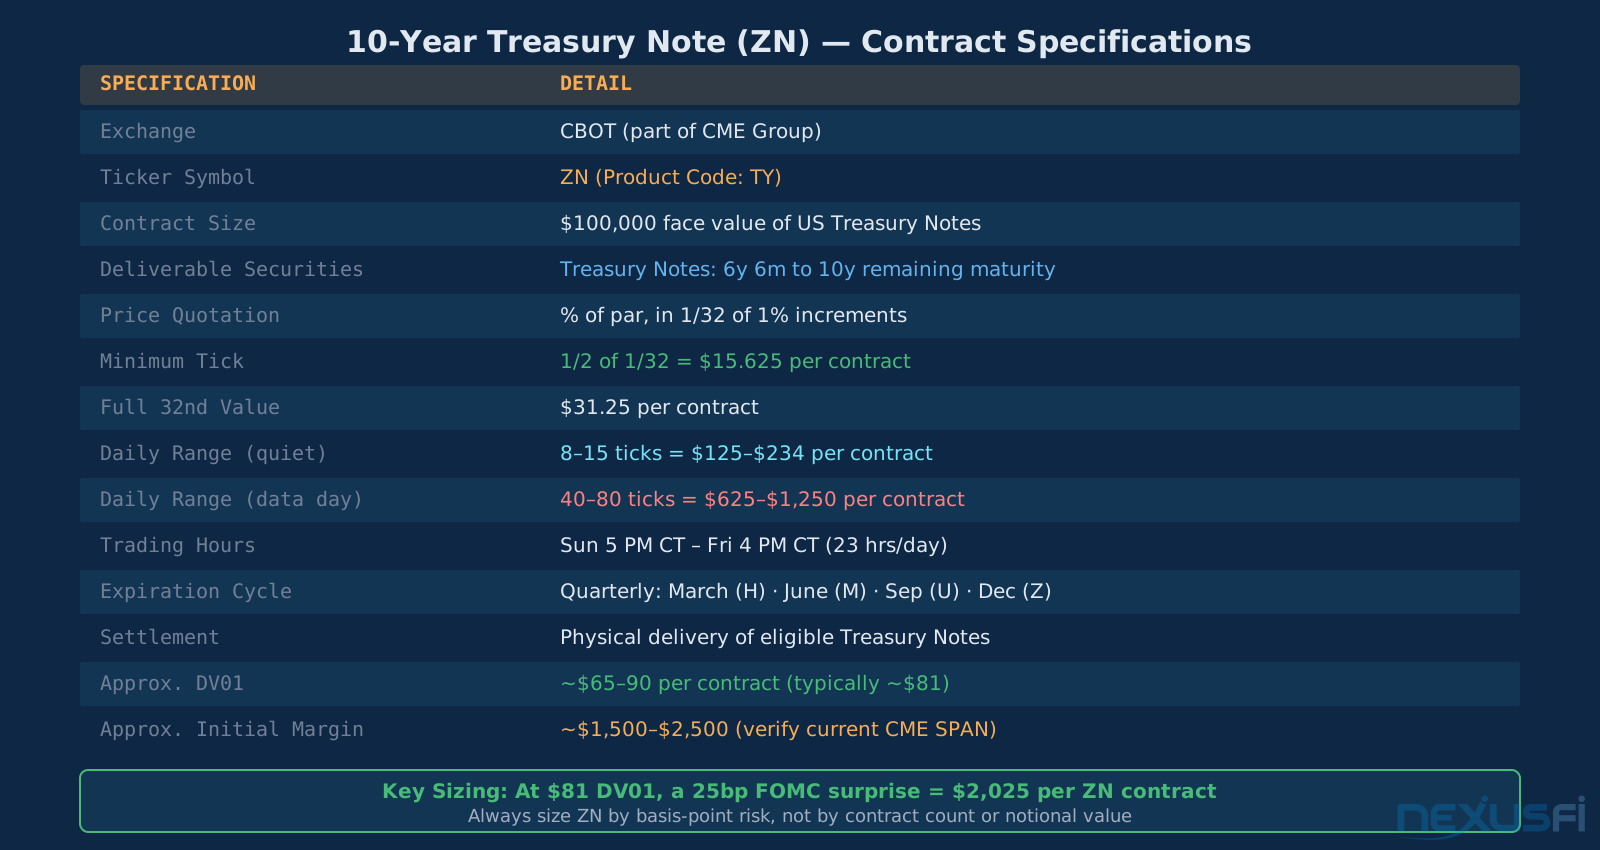
| Specification | Details |
|---|---|
| Exchange | CBOT (part of CME Group) |
| Ticker Symbol | ZN (Product Code: TY) |
| Contract Size | $100,000 face value |
| Deliverable | US Treasury Notes, 6y6m to 10y remaining maturity |
| Price Quotation | % of par, in increments of 1/32 of 1% |
| Minimum Tick | 1/2 of 1/32 (0.015625%) = $15.625 per contract |
| Full 32nd | $31.25 per contract |
| Trading Hours | Sunday 5:00 PM -- Friday 4:00 PM CT (23 hours) |
| Expiration Cycle | Quarterly: March (H), June (M), September (U), December (Z) |
| Settlement | Physical delivery of eligible Treasury Notes |
| DV01 (approx.) | ~$80-90 per contract per basis point |
The minimum tick of 1/2 of a 32nd ($15.625) means you need 2 ticks to make a full 32nd ($31.25). A "1-tick" scalp in ZN is $15.625 — meaningful at scale. Professional scalpers running 50 lots target 2-3 ticks per trade for $1,562-$2,343 per trade. The nominal contract size ($100,000) and daily range (8-20 ticks quiet, 40-80 ticks on data days) mean position sizing discipline is non-negotiable.
The CTD Enigma: Why ZN Acts Like a 7-Year #
This is the most misunderstood aspect of ZN, and it matters for both traders and hedgers.
ZN's deliverable basket includes Treasury notes with 6 years 6 months to 10 years remaining maturity. That's a wide window. The short position in ZN futures always delivers the cheapest-to-deliver note from this basket — the note that maximizes their economic advantage via the invoice price formula.
In practice, the CTD is almost never a 10-year note. In a normal (positive-sloping) yield curve environment, shorter-duration notes within the deliverable basket have less price volatility and lower conversion factor adjustments that favor delivery. The result: ZN's CTD tends to cluster around 7-8 year maturities.
@SMCJB made this point precisely on NexusFi: "ZN | 10 Year Treasury Notes (due to delivery requirements I gather this more represents 7yr than 10yr). TN | Ultra 10 Year Treasury Notes (newer contract, more the 'true' 10 year than ZN)."
@Schnook expanded on the practical implication for spread trading: "The regular ZN 10yr is more like a 7yr due to its broad eligibility for deliverables, so you'll get a much cleaner 2s/10s expression by using the TN ultra 10yr." This means if you're running a 2s/10s curve spread to express a view on the yield curve slope between 2-year and 10-year rates, using ZN gives you exposure to approximately a 2s/7s slope — not the 2s/10s you intended.
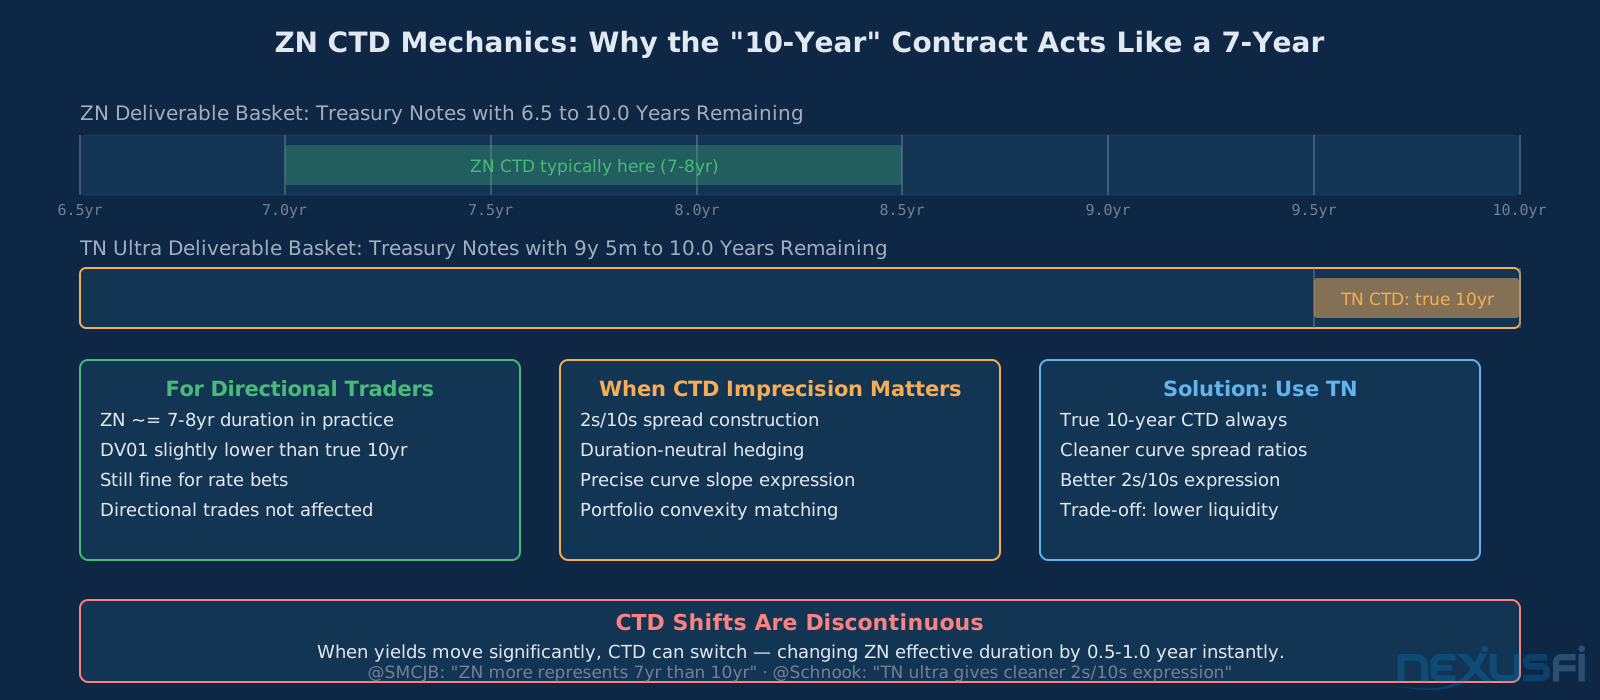
For most directional trades — betting on the 10-year yield's general direction — this CTD imprecision doesn't matter much. You're still capturing the core rate sensitivity. But for curve spreads where precise maturity exposure matters (2s10s, 5s10s), you should either use TN for the 10-year leg, or account for ZN's effective ~7-year duration in your ratio calculations.
CTD also shifts. When yields move much, the conversion factor calculations shift which note is cheapest to deliver. A CTD switch changes ZN's effective duration discontinuously — potentially by 0.5-1 year. This is why ZN's DV01 has a wider range ($65-$90) than simpler instruments: it depends on current market conditions and the CTD.
TN Ultra: The True 10-Year #
The TN Ultra 10-Year Note futures (CME ticker TN) was introduced in 2016 specifically to address the CTD imprecision problem. The deliverable basket: 9 years 5 months to 10 years. Narrow window. The CTD is always a genuine 10-year note.
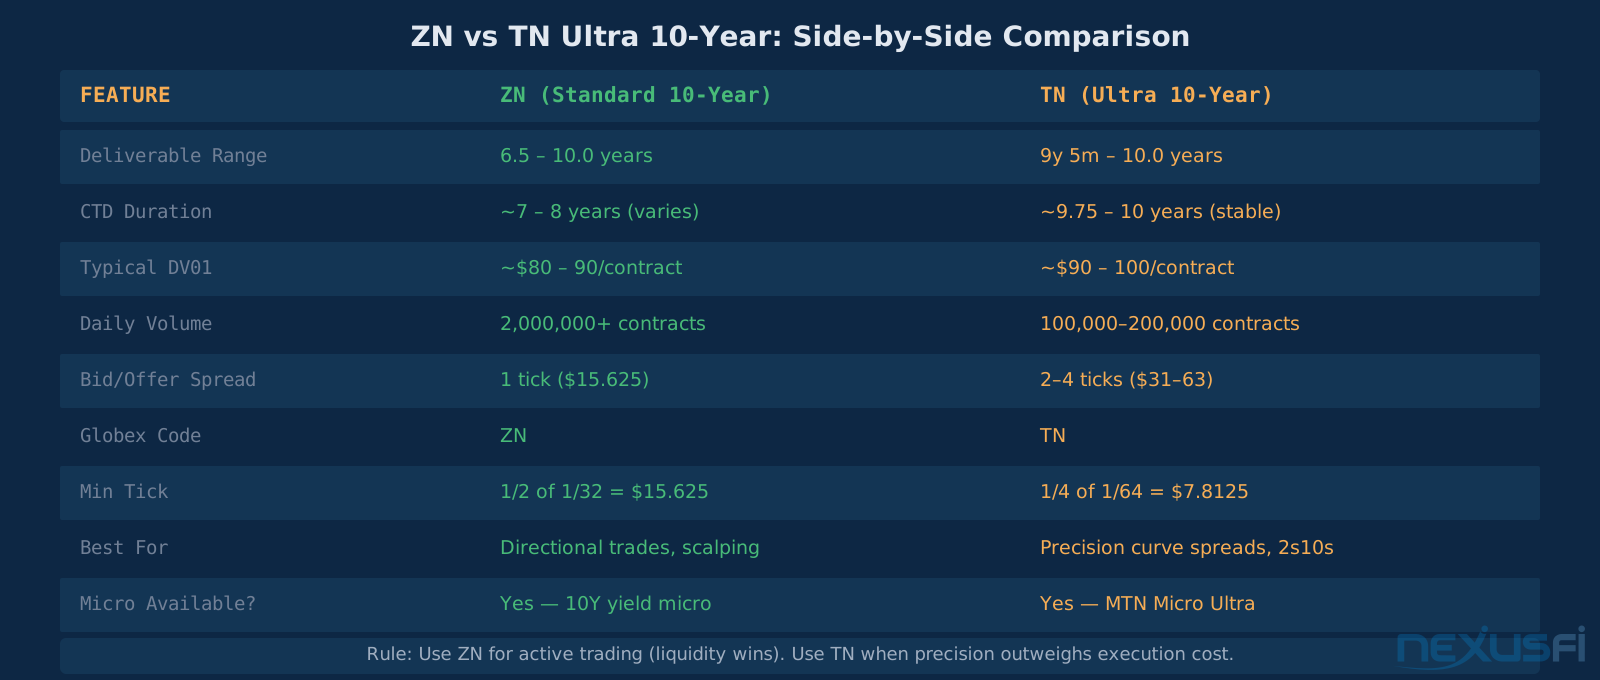
For yield curve spread trading where maturity precision matters, TN is the cleaner instrument. The 2s/10s spread in futures is better expressed as ZT vs. TN than ZT vs. ZN. Schnook's spreadsheet analysis showed that the DV01 ratio for a ZT/TN spread is approximately 2.8:1 — "so you can buy 3 ZT for every TN you buy and again be left slightly net long, or you can go 5:2 or 11:4 and be net short a few dollars per bp."
The limitation: TN's daily volume is roughly 10-20% of ZN's. The bid/offer spread in TN is wider, execution in size costs more, and the spread markets (TN vs. ZT, TN vs. ZN) are less liquid than the equivalent ZN spreads. For portfolio-level hedging where basis point precision matters, TN is worth the execution cost. For active trading, ZN's liquidity premium usually wins.
DV01 and Rate Sensitivity #
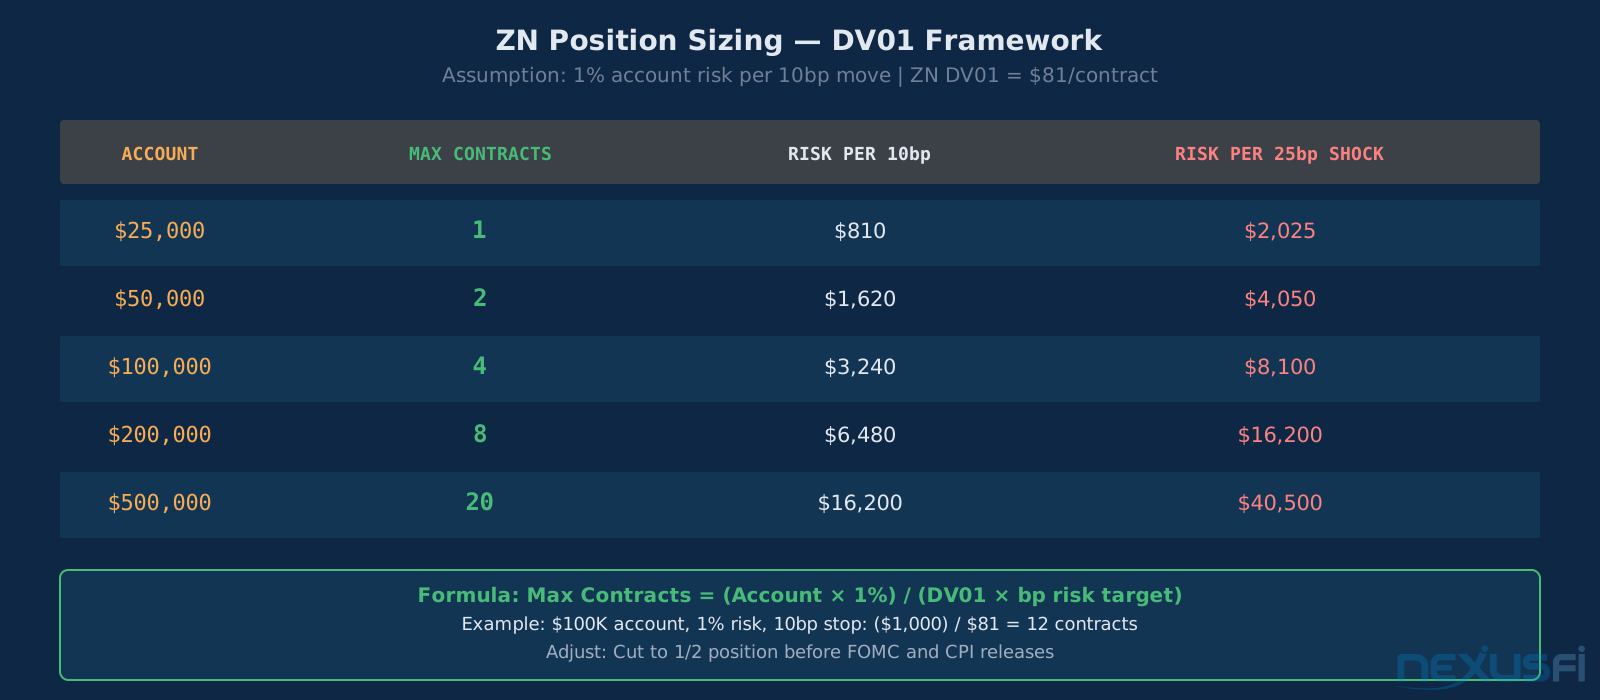
ZN's DV01 of approximately $81 per contract (from Schnook's CME Treasury Analytics data) is the foundation of every position sizing and risk calculation.
What this means in practice:
- A 10bp yield move: $810 per ZN contract
- A 25bp yield move (typical "surprise" on hot data): $2,025 per contract
- A 100bp (1 percentage point) move across a rate cycle: $8,100 per contract
- The 2022 hiking cycle (~500bp of hikes): approximately $37,000-$40,000 per contract over the cycle
This ratio — ZN DV01 is 1.91x ZT DV01 — drives standard 2s/10s spread construction.
Convexity matters for larger moves: the DV01 itself changes as prices move. For large yield moves (50bp+), ZN rallies faster than it falls for the same basis point move — bonds have positive convexity. This means a long ZN position earns slightly more than the linear DV01 projection on rallies, and loses slightly less on selloffs. For active traders, this is a minor consideration. For portfolio managers hedging large bond positions, convexity adjustment is essential.
Yield Curve Spread Strategies #
ZN's most powerful use cases involve yield curve spreads. These trades isolate the slope between two points on the curve, stripping out the directional rate bet and focusing purely on relative value.
NOB Spread (Notes Over Bonds)
The NOB (ZN vs. ZB) is the classic 10-year/30-year curve trade. Standard DV01-adjusted ratio: approximately 2 ZN per 1 ZB.
@jstnbrg, who spent 16 years trading interest rate futures on the CBOT floor and another 4 years on the screen, explained the ratio mechanics: "Historically the ratio for the NOB (10 Year Notes over Bonds) spread has ranged from about 2:1 to 5:3, the latter being more common... If you are long the NOB 1:1, you are short the market. Although recently ZB has really done its own thing relative to the rest of the curve."
Long NOB (long ZN, short ZB): Position for 10-30 spread steepening — 10-year yields fall faster than 30-year, or 30-year rises faster than 10-year. This typically occurs when the Fed cuts rates (front end rallies, but long end sells off on inflation concerns) or during growth scares where investors prefer shorter duration.
FITE Spread (Five-Year/Ten-Year)
The FITE (ZF vs. ZN) isolates the 5-10 curve segment. DV01-adjusted ratio: approximately 3 ZF per 2 ZN (3 x $47.50 = $142.50 vs. 2 x $81 = $162 — roughly neutral with slight long ZF bias).
This spread is driven by the market's view on where in the curve the Fed's impact will be felt most. When the Fed is aggressively hiking, the 5-year (ZF) tends to fall more than the 10-year (ZN) because 5-year yields are more tethered to near-term policy expectations. A hawkish FOMC statement often causes the FITE to steepen (5-year falls more than 10-year). As the market starts pricing in peak rates and future cuts, the FITE flattens as 5-year yields benefit most from the pivot anticipation.
2s/10s Spread
The 2-year/10-year spread (ZT vs. ZN or ZT vs. TN for precision) is the most-watched recession indicator in finance. Inversion of this spread — 2-year yields above 10-year yields — has preceded every US recession for the past 50 years.
@Schnook walked through the specific positioning for a bear steepener trade: "If I were looking to put on a 2s 10s steepener here I'd be looking at a bear steepener, that is, long end yields moving higher as opposed to (or more than) short end yields moving lower. This, being a bearish expression, implies you'd prefer to be net short DV01 rather than net long when all is said and done."
His preferred instrument for cleaner expression: "You'll get a much cleaner 2s/10s expression by using the TN ultra 10yr" — because TN's true 10-year CTD avoids the ZN duration drift discussed above.
Key Macro Drivers #
ZN's price action is dominated by macro forces. Technical patterns exist and are tradable, but they're secondary to the macro regime. Trade ZN with the macro current, not against it.
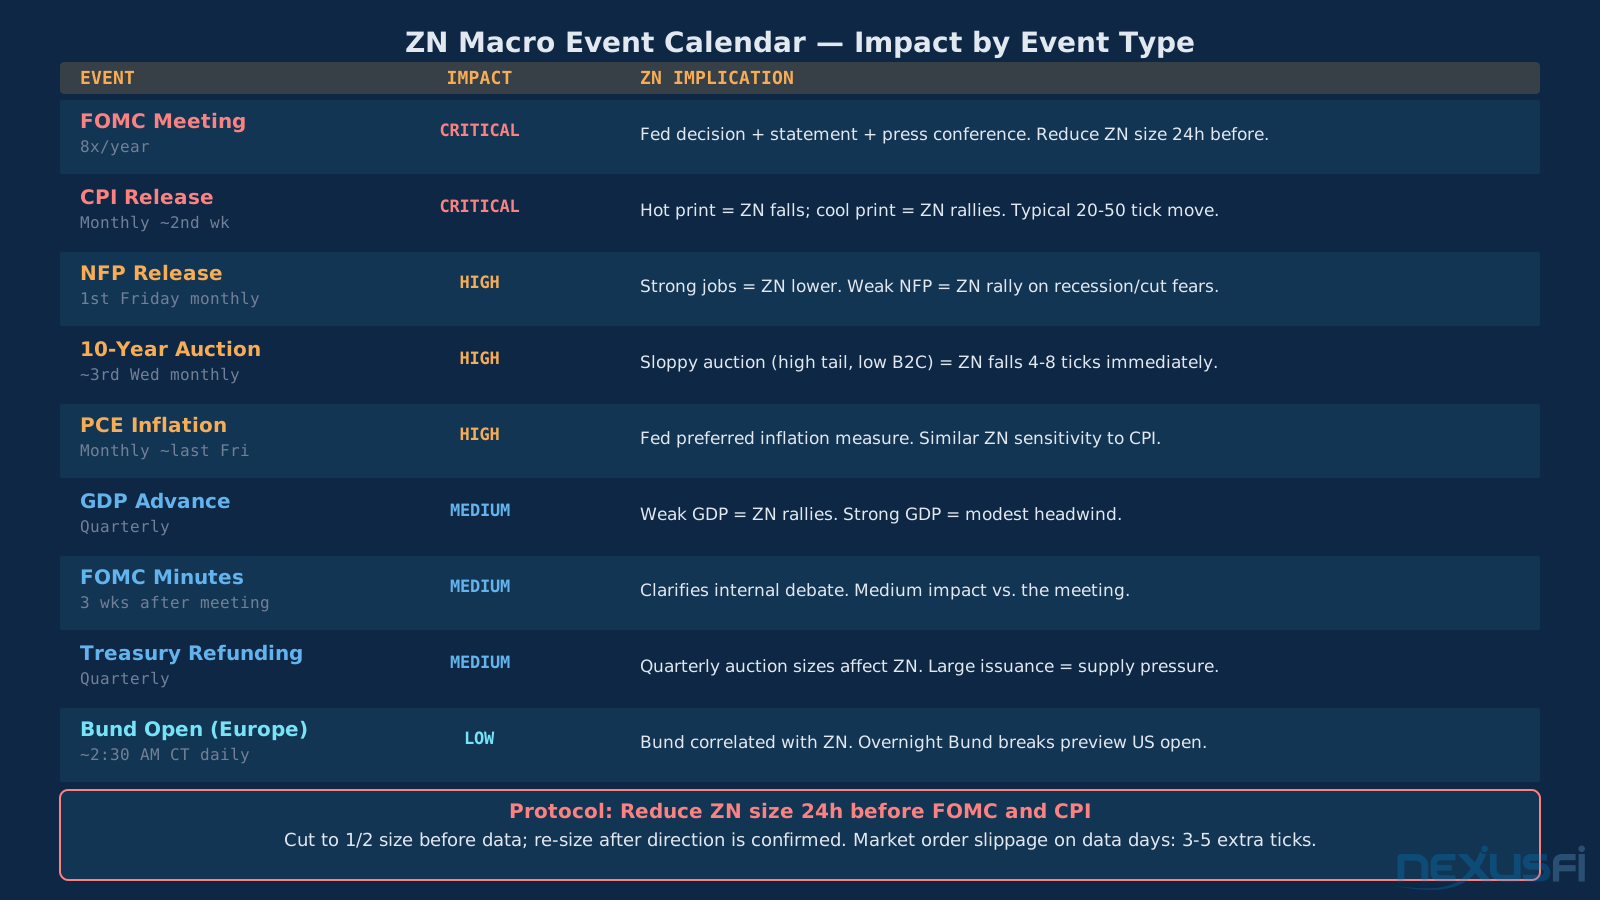
Federal Reserve Policy: The most important driver. Not the current Fed Funds rate — the expected path of the Fed Funds rate over the next 2-3 years. ZN responds to changes in rate expectations, which means it reacts to statements, speeches, and data that alter the perceived policy path. A 25bp hike that was 98% priced in moves ZN negligibly. A statement that shifts the terminal rate estimate by 25bp moves ZN immediately.
CPI (Consumer Price Index): Monthly inflation data. Hot CPI = more Fed hikes priced in = ZN falls. Cool CPI = fewer hikes, potential cuts = ZN rallies. The 10-year is especially sensitive to "sticky" inflation components — core services, wage-driven inflation — because these suggest the Fed must keep rates elevated for longer.
NFP (Nonfarm Payrolls): Monthly jobs data. Strong NFP = economy running hot = Fed has room to keep hiking = ZN lower. Weak NFP = recessionary fears = flight to safety AND Fed must cut = ZN rallies. NFP sensitivity varies by regime: in a hiking cycle, every hot print re-prices the terminal rate.
10-Year Treasury Auction: Typically held on the 3rd Wednesday of each month. Demand for new 10-year supply directly reprices ZN. A "sloppy" auction — high tail (price below WI), high dealer takedown, low bid-to-cover — signals weak demand. ZN typically falls 4-8 ticks immediately after a sloppy auction. Track the 10-year When-Issued (WI) yield before the auction as a real-time demand gauge.
Geopolitical and Flight-to-Quality Events: ZN is the world's safe-haven rate instrument. Wars, banking crises, systemic financial stress — all drive money into US Treasuries. The ZN rally during SVB's collapse in March 2023 was 2+ points (64+ ticks) in a week. These moves overwhelm any technical setup.
Trading Approaches #
Scalping ZN
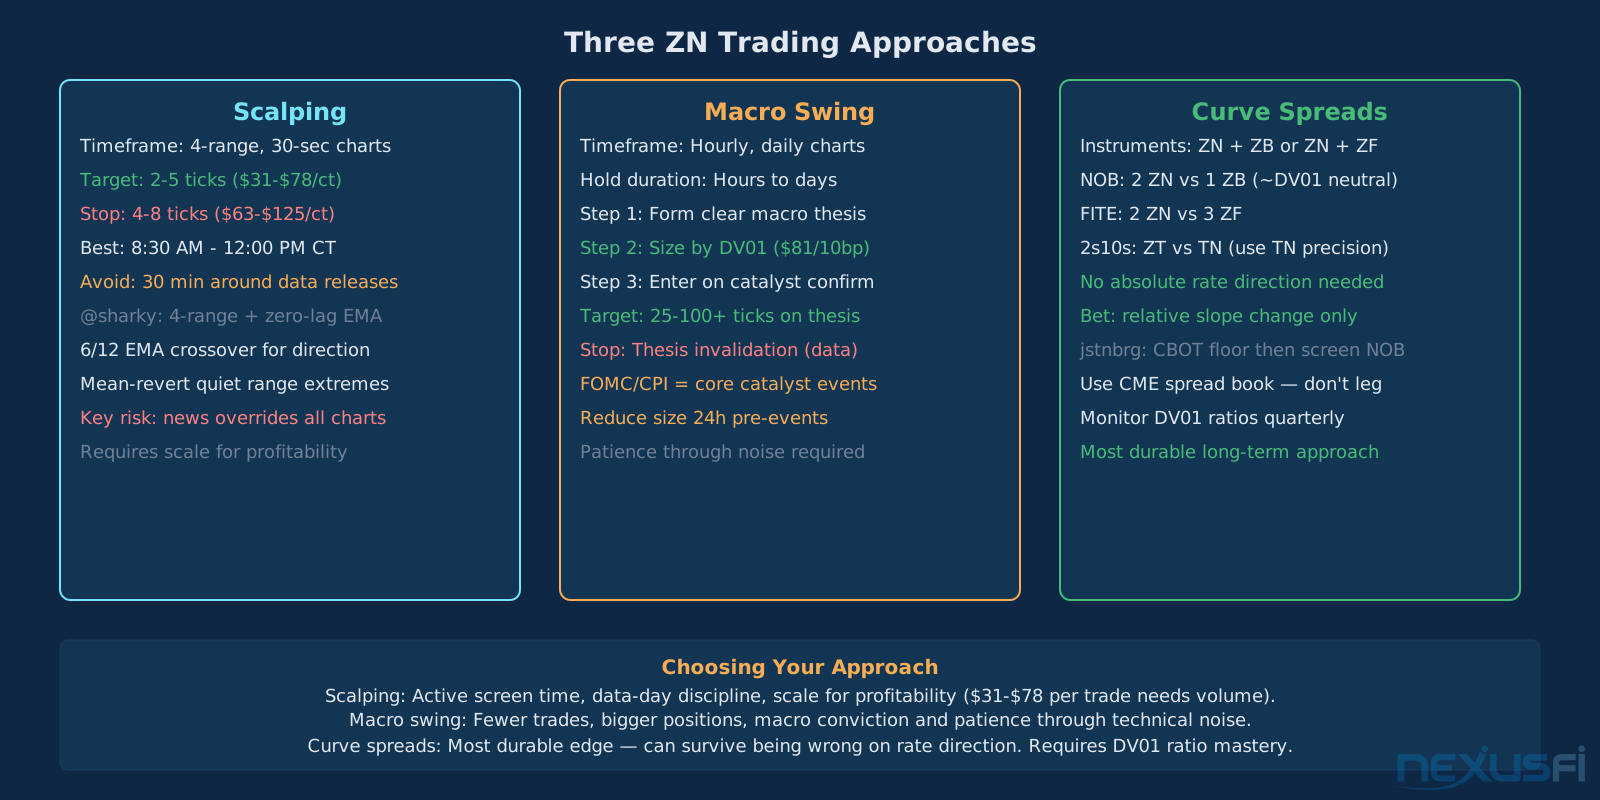
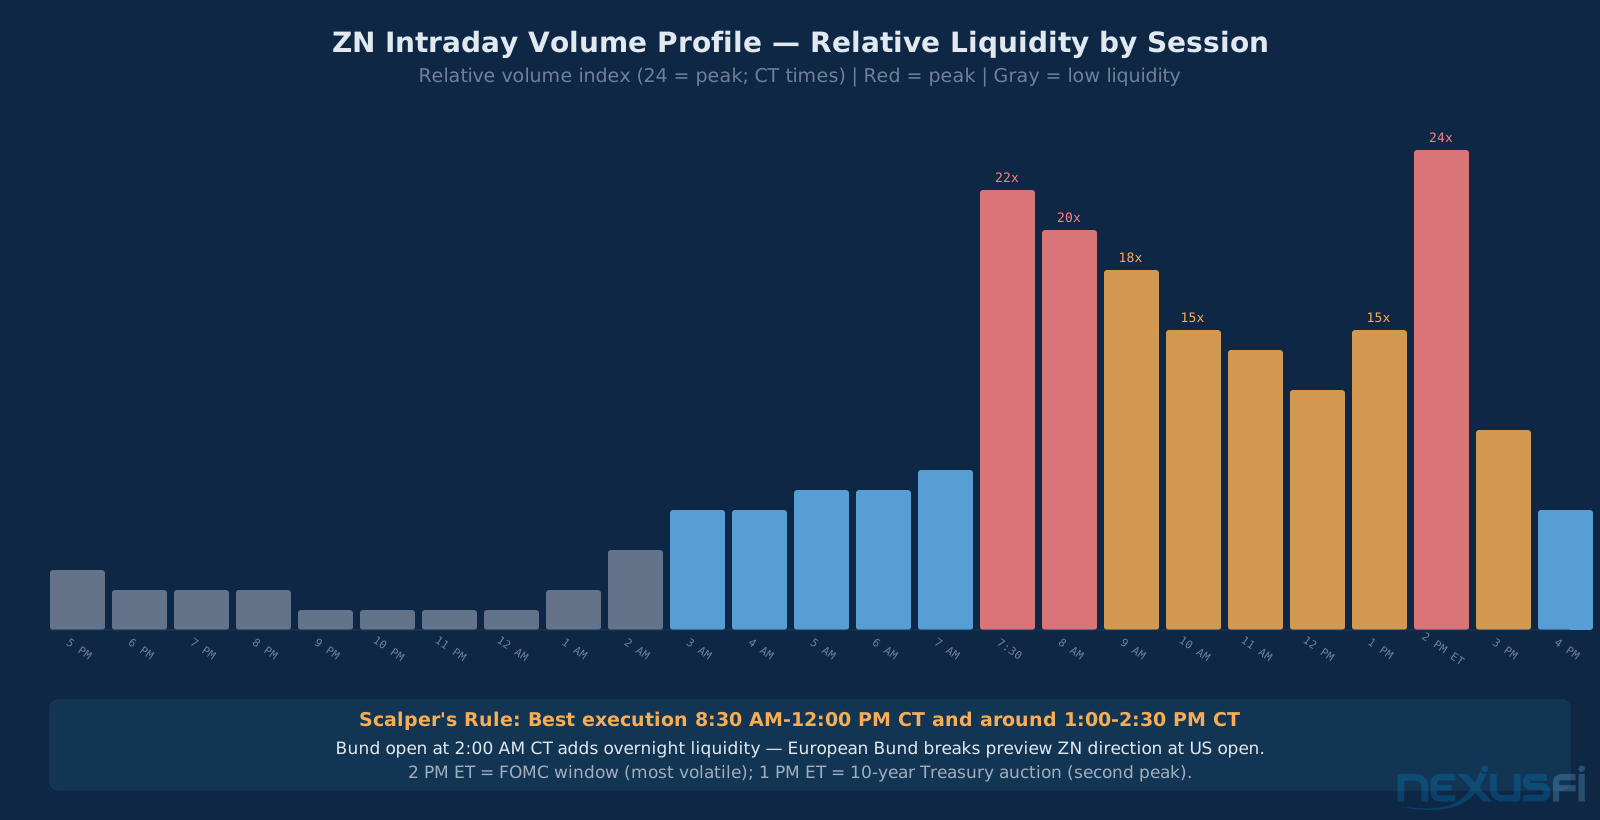
Three-tick scalps at $15.625 per tick = $46.875 per contract, per trade. At 50 lots, that's $2,343.75 for a 3-tick scalp. ZN at sufficient size becomes a meaningful income. The instrument's behavior demands different techniques than equity scalping: avoid news periods (30 min around CPI/NFP/FOMC), focus on the 8:30 AM-12:00 PM CT window, and flatten immediately when a fundamental driver takes over.
Macro Swing Trading
The highest-conviction ZN trades are macro swing positions held hours to days. Form a macro thesis (e.g., "the Fed will pause hikes at the next FOMC, and the market is underpriced for cuts in 6-12 months"), size by DV01 (1% of account risk per 10bp move), enter on trigger confirmation, and hold through noise until the thesis validates or invalidates.
The math must work before you put it on: 5 ZN contracts wrong by 50bp = $20,250. Macro swing trading requires sizing discipline equal to its conviction requirements.
Curve Spread Trading
For traders who want fixed income exposure without pure directional rate risk, yield curve spreads are the answer. The NOB (ZN vs. ZB) and FITE (ZF vs. ZN) spreads move on relative value between curve segments, not just on the overall direction of rates. jstnbrg's career as a floor and screen trader in exactly these spreads demonstrates the longevity of this approach across rate regimes.
Session Characteristics and Volume #
ZN trades 23 hours per day Sunday-Friday, but liquidity is dramatically different across sessions.
European Session (2:00 AM — 8:00 AM CT): Volume picks up meaningfully as the German Bund (FGBM on Eurex) begins trading. The Bund and ZN share approximately 75-85% yield correlation. Bund breaks during the European session frequently precede ZN directional movement at the US open.
US Pre-Market (7:00-8:30 AM CT): Data releases often land at 7:30 AM CT (CPI, NFP, GDP, retail sales). Volume spikes dramatically before and after. Professional traders position before data based on consensus estimates; execution in the 5 minutes after a major data release carries 3-5 tick slippage in practice.
Peak US Session (8:30 AM — 3:00 PM CT): Highest volume, tightest spreads, most reliable patterns. FOMC announcements at 2:00 PM ET. Treasury auctions at 1:00 PM ET. This is the scalper's window and the swing trader's trigger zone.
Roll Mechanics #
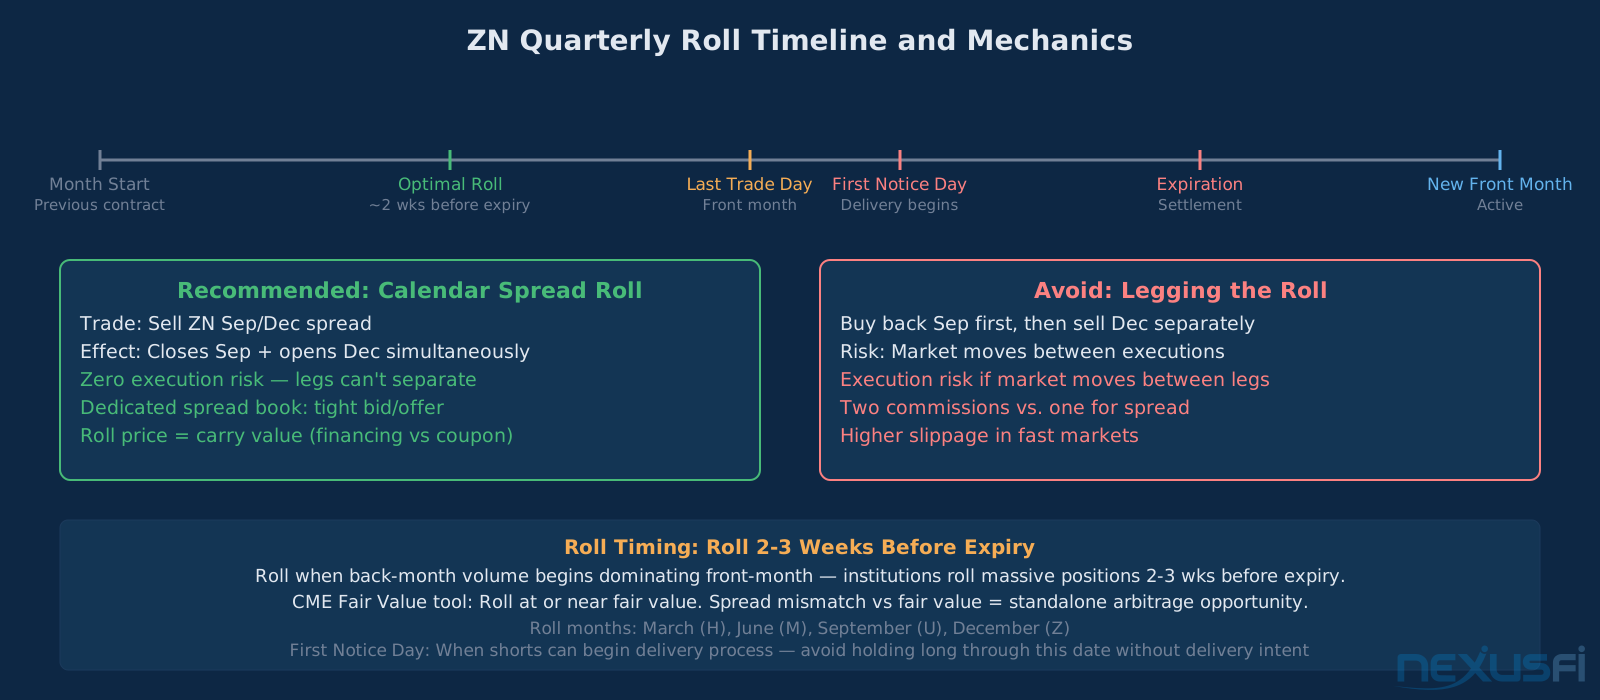
ZN expires quarterly. Active traders roll their positions before first notice day — typically 2-3 weeks before expiration when back-month volume starts to dominate front-month volume.
The roll uses the ZN calendar spread market: buy the ZN Sep/Dec spread (if rolling from September to December). This simultaneously closes the Sep position and opens the Dec position in a single order, eliminating execution risk from legging.
The roll price reflects the "net carry" — the financing cost of holding Treasury notes for one quarter minus the coupon income. CME provides the "Fair Value" of the calendar spread through their Treasury Analytics tools. If the actual spread market is materially different from fair value, there's a statistical tendency for reversion — sophisticated traders use this to time their roll and sometimes trade the roll mismatch as a standalone spread position.
Technical Analysis #
ZN shows cleaner technical patterns than many traders expect from a macro instrument. At ZN's scale, technical levels represent real liquidity clustering by institutional participants who also use chart analysis for execution.
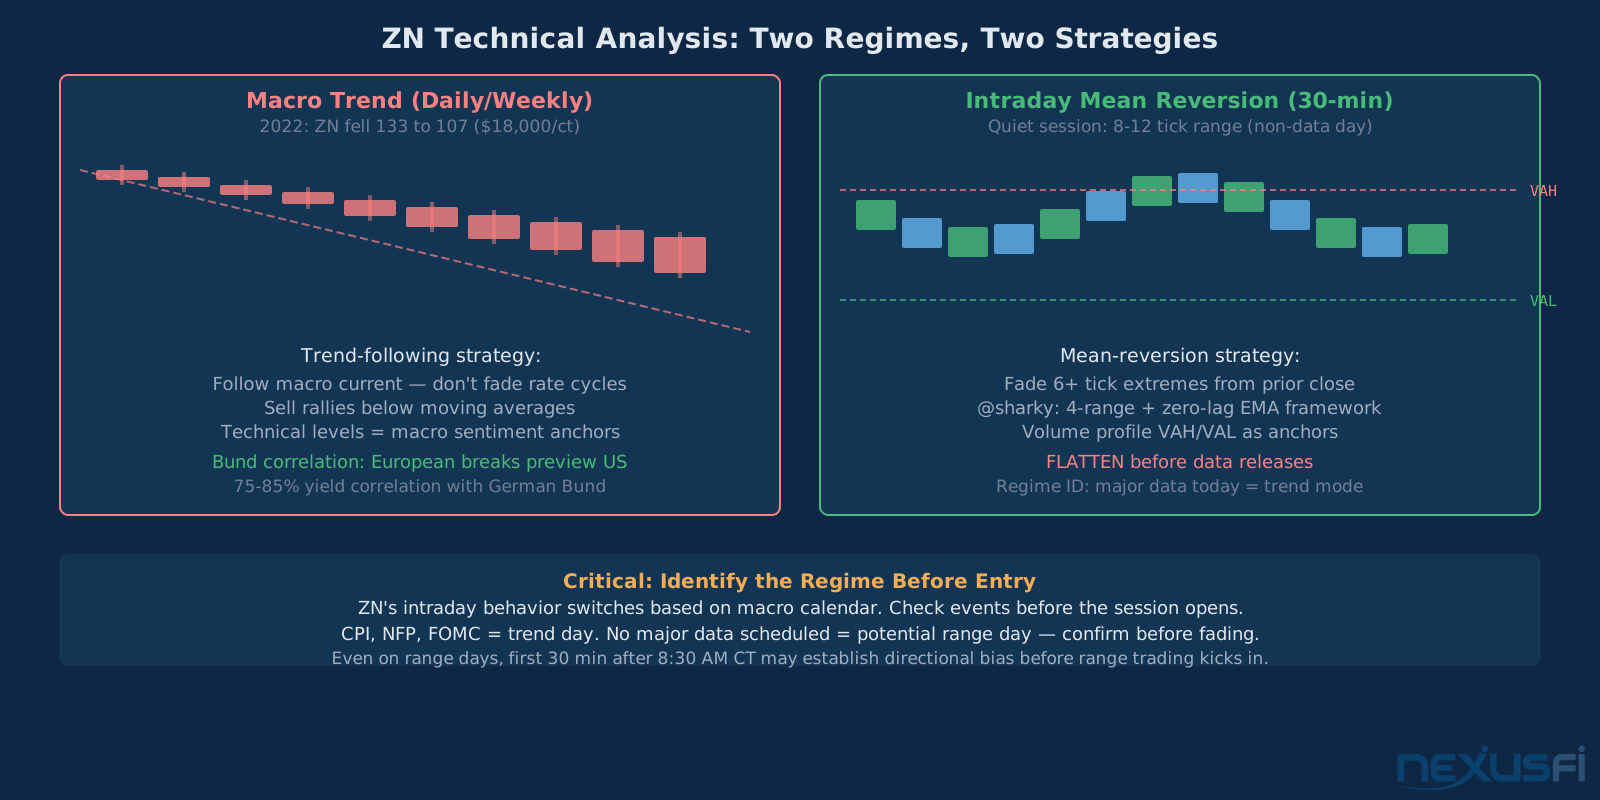
Macro trend following: In rate cycles, ZN trends persistently and powerfully. The 2022 bear market in bonds was the worst since the 1950s — ZN fell from near 133 to below 107 in 12 months, an 18-point decline worth $18,000 per contract. Trend-following approaches captured the bulk of this move.
Intraday mean reversion: Outside data-driven sessions, ZN shows strong mean-reversion on intraday timeframes. The daily range in quiet markets averages 8-15 ticks. Fading 6+ tick moves from the prior close has positive expected value in range-bound macro environments.
The Bund as a lead indicator: The German Bund (FGBM) and ZN share approximately 75-85% yield correlation. When the Bund breaks technical levels during the European session, ZN frequently follows at the US open. A Bund technical breakout overnight is a meaningful pre-positioning signal for ZN — not a certainty, but a directional bias to carry into the US session until US data overrides it.
Micro Instruments: 10Y Yield Futures and MTN #
Two micro instruments provide smaller-scale access to ZN's rate exposure.
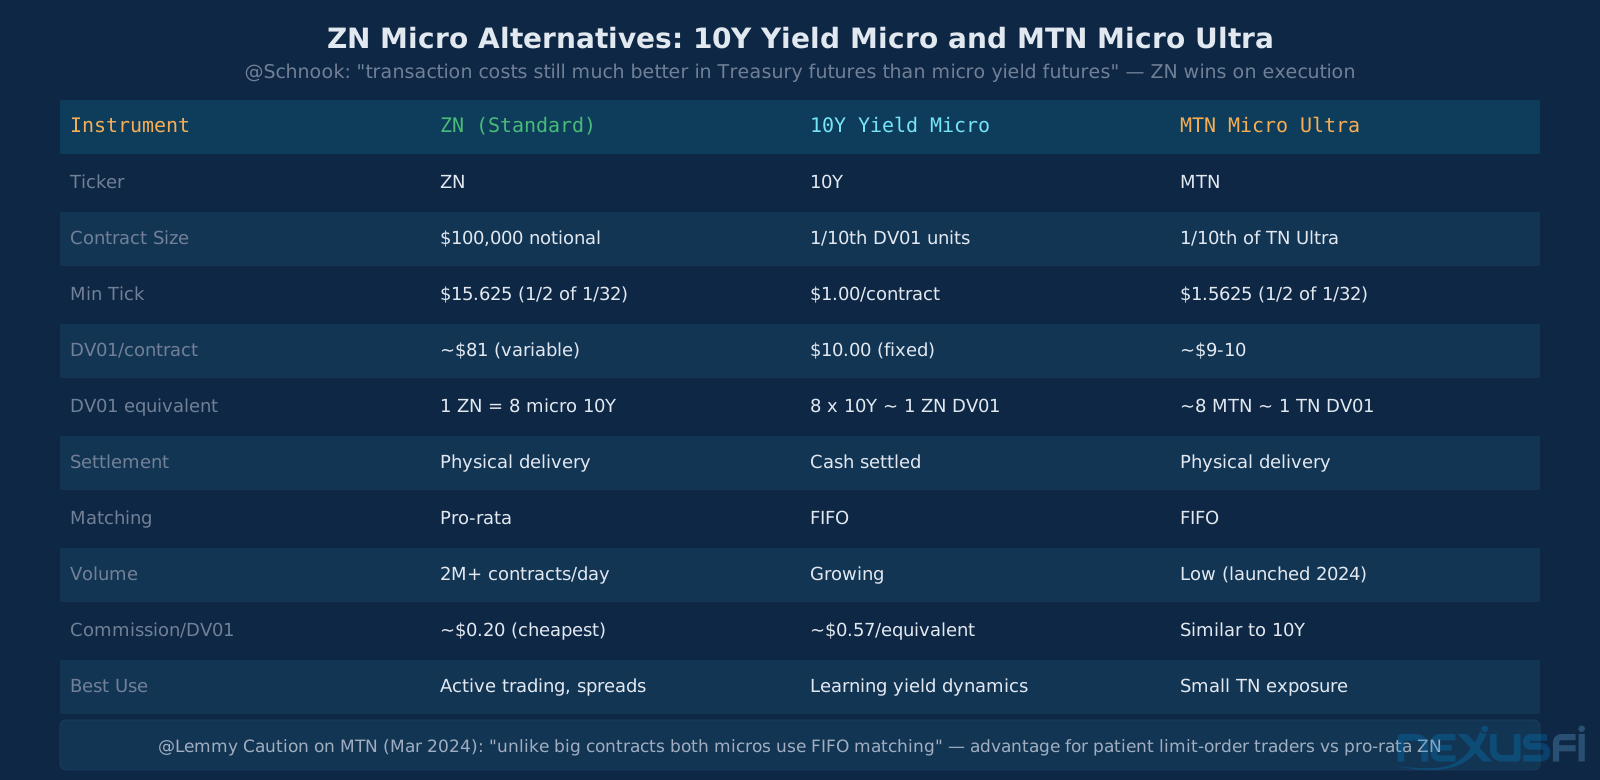
10Y Micro Treasury Yield Futures (Ticker: 10Y): Introduced August 2021. Cash-settled. References the 10-year yield directly — price moves in the same direction as yield, opposite to ZN. Fixed $10 DV01 per contract.
@Schnook compared the economics: "ZN, representing $100,000 notional, currently has a DV01 of $81, so right now you'd have to sell 8 micro 10yr yield futures to have the same DV01 as long 1 ZN contract." His commission comparison was definitive: "$0.57 one-way commission, so $4.56 for the DV01 equivalent of 1 ZN, which compares to just $1.62 for an actual ZN... so liquidity and transaction costs are still much better in the Treasuries than the Micro Yield Futures." His conclusion: "I still prefer using the regular treasury futures for yield spreads."
MTN Micro Ultra 10-Year Note (Ticker: MTN): Launched March 2024. One-tenth the size of the TN Ultra contract.
He noted the matching system advantage: "unlike the big contracts both micros use FIFO — first in, first out — matching." FIFO benefits patient limit-order traders; the regular ZN uses pro-rata matching which benefits large-order participants.
Risk Management #
ZN Sizing Rule Size ZN positions in DV01 terms, not contract count. Decide your maximum acceptable loss per 10bp move, then divide by $81 to get your contract count. A $500 risk budget per 10bp move = 6 ZN contracts. This keeps your risk proportional to actual rate sensitivity regardless of current yield levels.
Asymmetric downside on longs: Bond markets fall faster than they rise. Rate spikes are faster and more violent than rate rallies. If long ZN, budget for 3-4 extra ticks of slippage in your worst-case exit scenario versus what DV01 calculations suggest. The execution gap between theory and reality widens precisely when you most need to exit.
FOMC event risk: The Fed meeting is a binary risk event. Even if you're "right" on the macro thesis, a surprise statement can move ZN 30-50 ticks (approximately $470-$780 per contract) in minutes. Best practice: reduce ZN position size to half or less in the 24 hours before FOMC. Re-size after the event once direction is established.
Correlation risk breakdown: The traditional ZN/ES negative correlation (bonds rally when stocks fall) breaks down in inflationary environments. In 2022, ZN and ES both fell simultaneously. Don't use ZN as an ES hedge without confirming the current correlation regime.
Margin and liquidity: ZN requires roughly $1,500-$2,500 per contract in initial margin. Keep at least 3x the initial margin requirement in reserve when running ZN positions — margin calls can force liquidation at the worst possible times during market dislocations.
Putting It Together #
ZN is the world's benchmark rate instrument for a reason. The most sophisticated traders in the world — central bank open market desks, primary dealer bond trading operations, the largest macro hedge funds — all operate in ZN. That creates a formidable opposing force for retail traders, but also an extremely efficient and liquid market where genuine edge, properly sized, can compound over time.
The edge opportunities available to independent traders:
Macro thesis trading: The Fed's forward guidance is often misread by consensus. A trader who correctly identifies the market is underpricing rate cuts 12 months out — before the consensus catches up — has a defined, scalable entry in ZN with clear thesis validation via FOMC meetings and CPI data.
Curve spread precision: NOB and FITE spread strategies require no prediction of the absolute rate direction — just of the relative movement between curve segments. jstnbrg's career as a floor and screen trader in exactly these spreads demonstrates the longevity of this approach across rate regimes.
Scalping during defined windows: ZN's behavior in quiet markets — tight ranges, clean volume clusters, mean-reversion tendencies — supports a scalping approach during specific session windows. @sharky's 3-tick scalping methodology on the 4-range chart is a decades-proven framework at the right scale.
Know the CTD. Respect the DV01. Track the macro drivers before touching the charts. Build your approach around ZN's distinct personality: a macro-driven, liquidity-dominant rate instrument where size and precision beat intuition and guesswork every time.
Knowledge Map
Go Deeper
Build on this knowledgeReferences This Article
Articles that build on this topicCitations
- — How to trade Treasury bond future? (2010) 👍 3“i traded the 10 year tnote with rather good sucess, try a 4 range and work on your entries, make sure you catch the new moves as they happen. I used a 6 zerolag ema and a 12. I think you just have to play with it. Try to scalp it not day trade it -- I was scalping 3 ticks on my 4 range chart.”
- — 2s vs 10s (2022) 👍 3“The regular ZN 10yr is more like a 7yr due to its broad eligibility for deliverables, so you'll get a much cleaner 2s/10s expression by using the TN ultra 10yr.”
- — FOUR more NEW MICRO's - Micro Treasury Yield Futures coming 16 Aug'21 (2021) 👍 5“ZN, representing $100,000 notional, currently has a DV01 of $81, so right now you'd have to sell 8 micro 10yr yield futures to have the same DV01 as long 1 ZN contract. $0.57 one-way commission, so $4.56 for the DV01 equivalent of 1 ZN, which compares to just $1.62 for an actual ZN.”
- — FOUR more NEW MICRO's - Micro Treasury Yield Futures coming 16 Aug'21 (2021) 👍 7“I still prefer using the regular treasury futures for yield spreads. Liquidity and trading volumes have also remained much lower than I had expected.”
- — 2s vs 10s (2022) 👍 2“The actual DV01 ratio of 1.91 (66.37 for ZN vs 34.77 for ZT) leaves you slightly net long duration if you buy 2 ZTs against every ZN you sell.”
- — ZB ZN (NOB) (2011) 👍 5“If you look at the average daily range of ZF, ZN, and ZB, you'll notice that ZB is roughly twice as big as ZN which is about 50% larger than ZF. The reason is that actual Treasury securities of varying maturities are deliverable against these contracts, and the actual DV01 of those underlying securities differs.”
- — Is anyone actually making money? (2023) 👍 8“On the screen I traded the FITE (5 yr./10 yr. spread) and the NOB (10/30yr. spread). These are ratioed spreads, where the position sizing of the relative contracts is determined by the dollar value of a basis point change in the underlying cheapest to deliver cash instruments.”
- — FOUR more NEW MICRO's - Micro Treasury Yield Futures coming 16 Aug'21 (2021) 👍 15“ZN | 10 Year Treasury Notes (due to delivery requirements I gather this more represents 7yr than 10yr). TN | Ultra 10 Year Treasury Notes (newer contract, more the 'true' 10 year than ZN).”
- — New Micros: Ultra 10-Year & Ultra T-Bond -- Live Now (2024) 👍 4“Minimum tick: $1.5625 (1/2 of 1/32 of a point). Maintenance margin (on 25 March 2024): $280 USD. Unlike the big contracts both micros use FIFO -- first in, first out -- matching.”
- — Is ZN tradable these days? (2020) 👍 6“From my own perspective, I find that the DOM conveys a lot less useful information in Treasury futures as it does in equity index futures. The liquidity is much more widely dispersed and the average trade size is much smaller.”