



2-Year Treasury Note (ZT) Futures: The Complete Trading Guide to the Fed's Pulse
Overview #
If you want to know what the market thinks the Federal Reserve is going to do next, there's one futures contract that tells you with more precision than any other: the 2-Year Treasury Note futures, ticker ZT. The 2-year yield is the short end of the curve — the maturity closest to where the Fed sets rates — and ZT futures give you clean, liquid, leveraged exposure to those expectations with no single-stock risk, no options decay, and no overnight gap risk from earnings announcements.
Every major rate cycle in modern history has played out first in the 2-year sector. When the Fed starts hiking, 2-year yields lead. When cuts are coming, 2-year yields signal it months in advance.
That forward-pricing mechanism is what makes ZT valuable. You're not trading where the Fed is — you're trading where the Fed is going. Get the policy path right before consensus, and ZT is the cleanest instrument to monetize that view.
ZT's key characteristics set it apart from other Treasury futures: it has the lowest DV01 in the complex (approximately $38 per contract per basis point), the smallest tick value ($15.625 per 1/128 of a point), and the highest sensitivity to near-term policy changes. It's also the front leg in two of the most widely traded institutional curve spreads — 2s5s (ZT vs ZF) and 2s10s (ZT vs ZN). And at approximately $800-1,400 in initial margin, it's one of the most capital-efficient rate instruments available to retail traders.
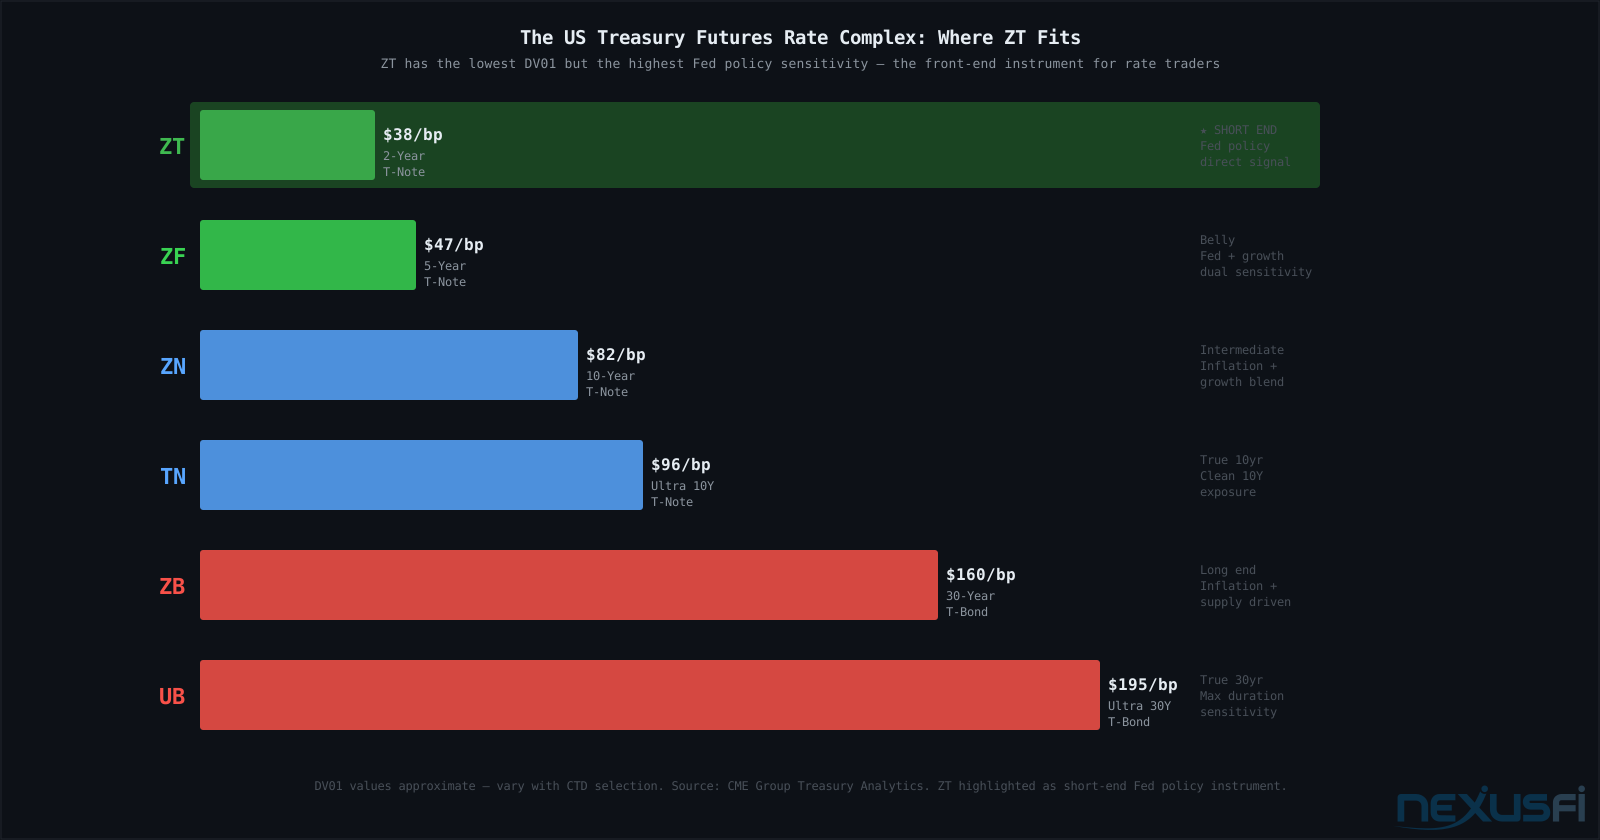
This guide covers everything you need to trade ZT: contract mechanics, DV01 risk sizing, the FOMC/CPI/NFP playbook, spread construction (2s5s and 2s10s), and the three volatility states that determine which strategy applies on any given day.
Contract Specifications #

| Specification | Details |
|---|---|
| Exchange | CBOT (part of CME Group) |
| Ticker Symbol | ZT (Product Code: TU) |
| Contract Size | $200,000 face value -- unique, 2x other Treasury futures |
| Deliverable | US Treasury Notes, 1 year 9 months to 2 years remaining maturity at delivery |
| Price Quotation | % of par, in increments of 1/128 of 1% |
| Minimum Tick | 1/128 of 1% = $15.625 per contract |
| Trading Hours | Sunday 5:00 PM -- Friday 4:00 PM CT (23 hours daily) |
| Expiration Cycle | Quarterly: March (H), June (M), September (U), December (Z) |
| Last Trade Day | Last business day of the calendar month preceding the delivery month |
| Settlement | Physical delivery of eligible 2-year Treasury Notes |
| DV01 (approx.) | ~$38 per contract per basis point |
| Initial Margin (approx.) | ~$800--$1,400 (CME SPAN-based, varies with volatility) |
The $200,000 face value is the one spec that catches traders off guard. Every other Treasury futures contract — ZF, ZN, ZB, UB — has $100,000 face value. ZT is doubled. This was done to bring ZT's dollar-per-tick closer to the other contracts, since the 2-year note's shorter duration produces a smaller price move per basis point than longer maturities.
Understanding where ZT sits in this family is essential for spread construction.
The deliverable basket — notes with 1y9m to 2y remaining maturity — is the narrowest in the Treasury complex. Unlike ZN (which has 6.5 to 10 years to maturity), ZT's eligible universe is tight. This keeps ZT closely anchored to the 2-year sector of the actual cash market.
DV01 and Rate Sensitivity #

DV01 is not a detail — it's the foundation of everything you do in ZT. Position sizing, spread ratios, stop placement, hedge construction — every decision flows from DV01.
For ZT, DV01 runs approximately $35-42 per contract depending on the current CTD. Use $38 as your working number for sizing and mental math. Here's what this means at the trade level:
- 1 ZT, 10bp move = $380
- 1 ZT, 25bp move = $950
- 5 ZT, 25bp move = $4,750
- 10 ZT, 100bp move = $38,000
The comparison across the curve matters for selecting the right instrument for your view. ZT DV01 ($38) is roughly half ZF's ($47), less than half ZN's ($82), and one-quarter ZB's ($160). For a 10bp adverse move, you'd lose $380 on ZT vs $820 on ZN. Same Fed surprise, different damage — which is why professional traders always specify their rates risk in basis points, not contracts.
@Schnook's actual data from CME analytics shows the precise relationship: "The DV01 ratio of 1.91 (66.37 for ZN vs 34.77 for ZT) leaves you slightly net long duration if you buy 2 ZTs against every ZN you sell." These numbers shift slightly as CTD changes, which is why spread traders rebuild their ratios at each quarterly roll. See the ZF futures guide for the belly's role in the rate complex.
Why ZT Is the Fed's Pulse #
[source] It is the same dynamic visible today: front-end rates move with the Fed, long-end rates move with global capital flows and inflation expectations, and ZT sits squarely where the Fed's direct influence is strongest.

Here's what makes ZT different from every other Treasury futures contract: it doesn't just react to Fed decisions — it anticipates them. The 2-year yield prices the expected path of the Fed funds rate over the next 8 to 20 quarters. When that path shifts, ZT moves first, often before ZN, always before ZB.
The mechanism is straightforward. The Fed funds rate is an overnight rate. The 2-year Treasury rate is a market-based average of expected overnight rates over the next two years. If the Fed signals more cuts are coming, the expected average drops — and ZT yields fall (prices rise) immediately, pricing in the new path. The 10-year and 30-year respond too, but they also incorporate term premium (compensation for uncertainty over longer horizons), which makes their moves less clean.
The leading indicator @Schnook documented — front-end yields moving months before actual Fed decisions — is among the most reliable patterns in fixed income: when ZT yields diverge sharply from the current funds rate, a change is coming.
For context, look at what happens during a surprise CPI print. When inflation comes in hotter than expected, the market immediately prices in more Fed hikes — and ZT futures sell off within minutes. ZN moves too, but the ZT move is proportionally larger in yield terms because the CPI data directly affects the near-term policy path, where ZT lives. The longer you go out the curve, the more the move gets absorbed by other factors.
Trading Strategies #

Strategy 1: Directional Fed-Path Trades
The core ZT trade is a directional bet on whether the Fed will be more or less hawkish than the market currently expects. If you think the market is pricing in too many hikes, you go long ZT. If you think the market is under-pricing the pace of cuts, you go long ZT. If you believe inflation will persist and the Fed will be forced to stay restrictive longer, you short ZT.
The critical discipline: sizing. Take your conviction on the rate move in basis points, multiply by DV01, multiply by account size fraction you're willing to risk. If you think there's a 50% chance the 2-year yield falls 30bp on the next CPI miss, and you're willing to risk 2% of a $100k account, your maximum ZT position is $2,000 ÷ ($38 × 30bp) = 1.75, round down to 1 contract. That's the framework. Adjust for your conviction.
Strategy 2: Yield Curve Regime Trading
Not all ZT positions are created equal. The four curve regimes determine whether outright ZT makes sense or whether you're better off with a spread trade:
- Bull Steepening (cuts coming): Long ZT outright -- this is ZT's best environment. Front end rallies hardest as cuts are priced in.
- Bear Flattening (aggressive hikes): Short ZT outright -- front end leads the selloff.
- Bull Flattening (long end leads rally): ZT lags in price terms; better to hold ZN/ZB or the spread rather than outright ZT.
- Bear Steepening (term premium rises): ZT is relatively stable; the back end sells due to supply/term premium, not policy path. Avoid outright ZT longs.
Identifying the regime before trading outright ZT dramatically improves the hit rate. See the yield curve trading guide for a framework on regime identification.
Strategy 3: Event-Driven Positioning
FOMC days, CPI releases, and NFP Fridays are where ZT generates its biggest moves. Three rules for trading ZT around events:
- Position before or flat during -- not after the spike. The initial move on CPI/FOMC is often the cleanest. Once it happens, bid/offer spreads widen, stops gap, and the initial move frequently reverses partially.
- Use tight stops in basis points, not ticks. If you're long ZT because you expect a dovish CPI, define your stop as "I'm wrong if yields rise more than 15bp." Translate that to ZT: 15bp × $38 = $570 per contract. Size to that, not to a tick count.
- Know your three states. ZT trades in compressed vol, pre-event, and event-spike modes. Each demands different position sizing and strategy selection (see the macro calendar section).
Spread Trading: 2s5s and 2s10s #
When constructing these spread positions,
[source] This is the fundamental tension in every ZT long position in a hiking cycle — you need the policy outlook to shift before the front end can rally in yield terms.

Spread trading is where ZT's institutional action lives. The 2s10s spread (ZT vs ZN) and the 2s5s spread (ZT vs ZF) let you express views on the yield curve's shape without taking full directional rate risk. You're betting on the relationship between short-end policy expectations and longer-term growth/inflation expectations — not on the absolute level of rates.
2s10s Construction
The 2s10s steepener: buy ZT, sell ZN. The 2s10s flattener: sell ZT, buy ZN. But you can't use equal contract counts — that leaves you with a massive DV01 mismatch and a de facto directional position.
The correct approach is DV01-neutral construction. @Schnook built his ratios directly from CME's Treasury Analytics tool: "The DV01 ratio of 1.91 (66.37 for ZN vs 34.77 for ZT) leaves you slightly net long duration if you buy 2 ZTs against every ZN you sell." Working with rounded current DV01 estimates ($82 ZN vs $38 ZT), the ratio is 82/38 = 2.16 — buy 2 ZT for every ZN sold (steepener) or sell 2 ZT for every ZN bought (flattener).
The residual duration (2 × $38 = $76 vs $82 = net $6 long) is intentionally small and generally acceptable. @Schnook's view: "It's such a small residual amount that it shouldn't hurt you too much. You can even view it as a partial hedge."
2s5s Construction
The 2s5s uses ZT vs ZF (DV01 ratio ~47/38 = 1.24, so roughly 5 ZT vs 4 ZF). This expresses the relative repricing of the policy-sensitive front end versus the belly.
See the ZF complete guide for belly dynamics.
What Moves the Spread
The 2s10s reflects the gap between policy expectations and long-term inflation/growth. Bear steepener = rising term premium. Bull steepener = aggressive cuts priced in. Bear flattener = rapid hike pricing. Inversion = historically one of the most reliable recession signals, timing uncertain.
FOMC, CPI, and NFP: Key Macro Drivers #


FOMC Meetings
FOMC is the most direct ZT trigger. The rate decision itself is rarely a surprise — but the statement language, press conference tone, dot plot trajectory, and any QT changes can shift the policy path much. ZT reprices immediately on forward guidance changes, even when the rate itself is held.
Key FOMC patterns: spreads widen 12-24h before (reduce size). First 15 minutes are most volatile — initial move often overshoots, reversals within 30-60 minutes common. Press conference comments frequently matter more than the decision itself.
CPI Releases
CPI is ZT's other major trigger. When inflation data surprises to the upside, the market prices in more Fed hikes (or fewer cuts) — ZT yields rise (price falls). When inflation comes in softer than expected, ZT rallies as rate cut odds increase.
What ZT actually cares about: not just the headline number, but core CPI, services inflation, and the "supercore" (services ex-shelter). These components tell the Fed how persistent inflation is. A one-time jump in energy prices barely moves ZT; persistent core services inflation can reprice the entire front end by 15-25bp in minutes.
ZT's CPI move pattern: initial overshoot → partial reversion. Algos overreact as liquidity providers step back; 30-60 minutes later the market retraces partially. Mean-reversion fades work but require pre-positioned stops.
NFP (Non-Farm Payrolls)
NFP moves ZT through two channels: the labor market's effect on growth expectations, and wage growth's effect on inflation persistence. A strong NFP with rising wages is hawkish for rates — ZT yields rise. A weak NFP signals potential rate cuts ahead — ZT rallies.
Unlike CPI, NFP's ZT impact is regime-dependent: strong labor prolongs hikes but only moderates easing. Automated NFP strategies that worked in one cycle often fail in the next. See trading economic data releases for the full framework.
Session Characteristics and Liquidity #

[source] Understanding that the market prices binary distributions, not single paths, changes how you read the ZT setup around each FOMC cycle.
ZT trades 23 hours a day, but liquidity is not evenly distributed across those hours. The three distinct liquidity windows determine which strategies are viable at what times.
US Cash Hours (8:00 AM — 3:00 PM ET): Peak liquidity. Bid/offer spread is typically 1-2 ticks. Order book depth runs deep with institutional participation. This is where directional and spread trades execute cleanly. Most of the meaningful price discovery happens in this window.
Asian Session and Overnight (8:00 PM — 3:00 AM ET): Thinnest liquidity. Avoid size during this window unless you're running a systematic strategy with specific overnight edge. Spreads can be 3-5+ ticks. Significant news (geopolitical events, emergency Fed communication) can create violent, gapping moves with poor fill quality.
The critical rule for event traders: avoid entering ZT positions in the 15-30 minutes immediately before scheduled FOMC/CPI/NFP releases. The order book thins dramatically as market makers step back, and the spread can widen to 4-8 ticks. The only traders who operate profitably in that immediate pre-release window are high-frequency firms with co-location and specialized infrastructure. Everyone else gets wider fills and worse slippage. See exchange co-location for the infrastructure details.
Roll Mechanics and Contract Delivery #

ZT has quarterly expiration: March, June, September, and December. Unlike shorter-dated futures (where delivery is automatic if you hold through expiration), Treasury futures require active management of the roll.
When to Roll: Open interest in the front month typically peaks 10-15 days before the last trade day, then migrates rapidly to the next contract. Liquidity in the expiring contract drops sharply once open interest shifts. Most traders should roll when the front month's average volume drops below the back month — typically 7-10 days before expiry.
The Roll Spread: Rolling involves simultaneously selling the front month and buying the back month. The price differential (calendar spread) reflects carry, the cost of financing, and any supply/demand imbalance. Professional traders monitor the roll spread actively — an abnormally cheap or rich roll can signal supply pressures or unusual positioning.
Physical Delivery: If you hold ZT short through first notice day, you can be required to deliver actual Treasury Notes. This is generally not a retail trader event — your broker will close or roll positions before delivery. But understanding that ZT is a physical delivery contract explains why the basis (futures price vs cash price) narrows predictably near expiration.
CTD at Roll: The cheapest-to-deliver bond changes across quarters as yields shift and different maturities become optimal to deliver. DV01 changes so. Rebuild your spread ratios at each roll using current CME Treasury Analytics data — don't assume the ratio from the previous quarter still applies. See ZB/ZN treasury futures for how delivery mechanics work across the curve.
Risk Management for ZT Traders #
[source] The risk takeaway: knowing which instrument fits your macro view matters as much as having the view.

The core rule: Size ZT in basis points of rate risk, not in contract counts. "I'm risking $500" is incomplete. "I'm risking 500 / $38 DV01 × 1 contract = 13bp of adverse yield move per contract" is the correct framing. Define your stop in basis points, then determine how many contracts match your dollar risk tolerance.
For a 25bp stop (roughly half a typical CPI surprise move), the position cost per contract is $38 × 25 = $950. On a $100,000 account with 2% max risk per trade, that's $2,000 / $950 = 2.1 contracts. Round to 2. This is the outer bound — not the target. Conviction and market condition should often push you to 1 contract or less.
Event-day sizing: On FOMC, CPI, and NFP days, cut your maximum size by at least 50%. Not because the expected move is smaller — it's typically larger — but because the move can exceed your stop before you can exit. A 30bp ZT move in 90 seconds is not unusual on CPI surprise. If you're holding 5 contracts, that's $5,700 in slippage-inclusive losses before you can act. Size for the scenario where you're wrong and the market gaps through your stop.
Spread position sizing: When trading 2s10s, size the spread's DV01 risk, not the individual legs. A 2 ZT / 1 ZN DV01-neutral spread has residual net DV01 of approximately $76 - $82 = -$6 (slightly net short duration). Size the spread by the residual DV01 and the expected spread move in basis points. A 2s10s move of 15bp with residual DV01 of $6 = $90 — almost nothing directionally. The spread P&L comes from the differential move between legs, which can be volatile around events. Position sizing frameworks give the complete multi-leg approach.
Correlation risk in tightening cycles: In 2022, ZT fell 15+ points while ES also fell 25%. The traditional "when stocks fall, bonds rally" (risk-off bid) did not apply. When the Fed is hiking aggressively to fight inflation, stocks and bonds are correlated — both fall as rate hikes reduce equity valuations while simultaneously pushing ZT lower. If you're using ZT as a stock market hedge, understand that this correlation is regime-dependent. It works beautifully in growth scares; it fails completely in inflation-driven rate cycles.
ZT Correlation and Multi-Market Analysis #

ZT vs ES (S&P 500 Futures): In growth-scare/recession-fear regimes, money flows from equities into Treasuries. ZT rallies as ES falls — the classic risk-off pattern. But this correlation inverts during inflationary tightening: in 2022, both ES and ZT fell together. Know which regime you're in before assuming ZT provides equity hedging.
ZT vs USD (Dollar Index Futures): Higher US rates generally support the dollar — when ZT yields rise, the dollar tends to strengthen. ZT and DX (Dollar Index) often move in opposite directions: ZT price falls as yields rise, DX price rises. Traders watching for currency confirmation of rate moves use this relationship.
ZT vs ZQ (Fed Funds Futures): The Fed Funds futures (ZQ) price the expected overnight rate at specific FOMC meetings. ZT prices the expected average over 2 years. These two instruments should be consistent — if ZT implies a terminal rate of 4.5% but ZQ contracts imply 5.0%, there's a pricing discrepancy that sophisticated traders arbitrage. Monitoring ZQ alongside ZT gives you the market's exact probability distribution for near-term Fed moves.
ZT vs SR3 (SOFR Futures): SOFR futures replaced Eurodollar futures as the primary short-end rate market. The SOFR curve and ZT should price consistently — SOFR's 3-month tenors stack to create the same policy path that ZT prices in the 2-year sector. Discrepancies between the SOFR strip's implied 2-year rate and actual ZT yield create basis trading opportunities.
Micro 2-Year Treasury Yield Futures (2YY) #

The CME launched Micro Treasury Yield futures (2YY) in August 2021. The 2YY is cash-settled, references yield directly, and has a fixed $10 DV01 — compared to ZT's ~$38.
The quoting direction is intuitive: price rises when yield rises.
In practice, the 2YY costs more per DV01-equivalent than ZT. To match one ZT's $38/bp exposure, you need 3.8 micro yield contracts — with higher commissions and wider spreads than ZT.
The 2YY's valid niche: learning yield curve mechanics intuitively and taking fractional-DV01 positions. For active trading, spread construction, or hedging, ZT's liquidity advantage dominates.
Putting It Together #

ZT is not a technical indicator instrument. There's no footprint analysis, no order flow pattern that reliably predicts 2-year yield direction. The people on the other side of your ZT trades are Fed watchers, macro fund analysts, bank hedging desks, and CTA systems running billions in assets. They're wrong sometimes — which is when the edge is available — but the edge comes from macro analysis, not chart reading.
The available edges in ZT are specific: correctly anticipating the Fed's next move before consensus reprices, identifying when the market has over- or under-priced an inflation or labor data point, spotting curve spread mispricings between 2s5s and 2s10s relative to the macro backdrop, and constructing duration hedges for equity portfolios in regimes where the negative stock-bond correlation holds.
None of these edges are consistent or mechanical. ZT is an expression vehicle for macro views. If your macro thesis is correct, ZT is one of the best instruments to monetize it — liquid, capital-efficient, directly tied to Fed policy, and clean enough to express the rate move without contamination from credit risk, term premium, or equity sentiment.
The discipline required: always size in DV01 terms, always know which regime you're in, always reduce size around events, and always know where the spread ratios are for 2s5s and 2s10s before you build a position in either leg. ZT is a precision instrument. Use it that way.
For the complete rate complex picture, read Treasury Futures (ZB/ZN) for the long end, ZF Futures for the belly, Fed Funds Futures (ZQ) for direct FOMC probability trades, and SOFR Futures (SR3) for the modern short-end rate curve. Together they give you the full yield curve toolkit that professional rates traders use every day.
Knowledge Map
Go Deeper
Build on this knowledgeReferences This Article
Articles that build on this topicCitations
- — 2s vs 10s (2022) 👍 3“I built a simple spreadsheet using DV01 data straight from the CME website. The DV01 ratio of 1.91 (66.37 for ZN vs 34.77 for ZT) leaves you slightly net long duration if you buy 2 ZTs against every ZN you sell.”
- — General bond / interest rate discussion (2021) 👍 3“ZT | 2 Year Treasury Notes... ZN | 10 Year Treasury Notes (due to delivery requirements I gather this more represents 7yr than 10yr)... TN | Ultra 10 Year Treasury Notes (newer contract, more the true 10 year than ZN). Fed Funds, Eurodollars and SOFR contracts all price as 100 minus the interest rate, while Micro contracts price as Yield/Interest Rate directly.”
- — General bond / interest rate discussion (2021) 👍 2“Larger movements in front end rates almost always lead actual changes in Fed policy by at least a couple of months. Two year yields peaked at just under 3% about 6 weeks before the final rate hike in 2018, and then started to decline almost 9 months before the first ease.”
- — FOUR more NEW MICRO's - Micro Treasury Yield Futures coming 16 Aug'21 (2021) 👍 7“Liquidity and trading volumes have been abysmal. I still prefer using the regular treasury futures for yield spreads. Poor liquidity, high transaction costs, and monthly rolls just end up taking way too much out of my positions.”
- — FOUR more NEW MICRO's - Micro Treasury Yield Futures coming 16 Aug'21 (2021) 👍 5“The DV01 on these contracts is ten dollars, whereas the 10yr note contract (ZN), representing $100,000 notional, currently has a DV01 of $81, so right now you'd have to sell 8 micro 10yr yield futures to have the same DV01 as long 1 ZN contract. Liquidity and transaction costs are still much better in the Treasuries than the Micro Yield Futures.”
- — 2s vs 10s (2022) 👍 2“The only way the front end rallies meaningfully here is if the Fed hard pivots and adopts an aggressive easing posture inside of the next six months. Watch how these huge treasury bond auctions go, month after month, without the Fed there to support them.”
- — Spoo-nalysis ES e-mini futures S&P 500 (2014) 👍 13“Short-term treasuries track what the fed does with interest rates, and longer maturities are more influenced by inflation. The short end of the curve has seen yields going higher in expectation of the fed hiking rates. The long end stayed strong because of tepid inflation expectations -- the result: bull flattening of the yield curve.”
- — General bond / interest rate discussion (2021) 👍 2“ZT is down more than 10/32nds from its Q3 close. If you were betting on a more hawkish Fed, you were probably short the front end or in bear-flattener curve expressions, which have done quite well. The typical retail futures trader isn't selling Eurodollar calendars -- he's more likely to just short a bond contract or two because that's where you get the most bang for your buck (max DV01).”
- — Spoo-nalysis ES e-mini futures S&P 500 (2015) 👍 25“What will soon become the dominant theme is the re-emergence of the Fed's failure to control long-term rates -- Greenspan's Conundrum redux. Foreign capital flowing into U.S. treasuries makes investment in U.S. assets attractive while the yield curve flattens.”
- — General bond / interest rate discussion (2021) 👍 2“The Eurodollar curve is not indicative of one projected path of interest rates -- it's indicative of a binary outcome. Either the recovery continues, inflation remains above the Fed's comfort zone, and they tighten more aggressively... or the economy pukes and the Fed never makes it to their first hike.”
- — Spoo-nalysis ES e-mini futures S&P 500 (2014) 👍 13“Nominal 2 year yields have tended to coincide with the nominal growth of GDP, except during QE/ZIRP. If not for the Fed's accommodation, today's 4% nominal GDP would give us 2 year yields of 3.5-4.0%, instead of 0.70%. What the curve is saying is that we are not going to see enough growth to get back to this norm again.”
- — CME Group: 2-Year Treasury Note Futures Contract Specifications