



5-Year Treasury Note (ZF) Futures: The Complete Trading Guide
Overview #
The 5-Year Treasury Note futures contract — ticker ZF on CME/CBOT — is the belly of the US yield curve, and understanding it means understanding how the market prices monetary policy expectations. Not the immediate policy (that's the 2-year end), not long-term inflation expectations (that's the 30-year), but the key middle ground where short-term Fed action meets long-term economic sentiment.
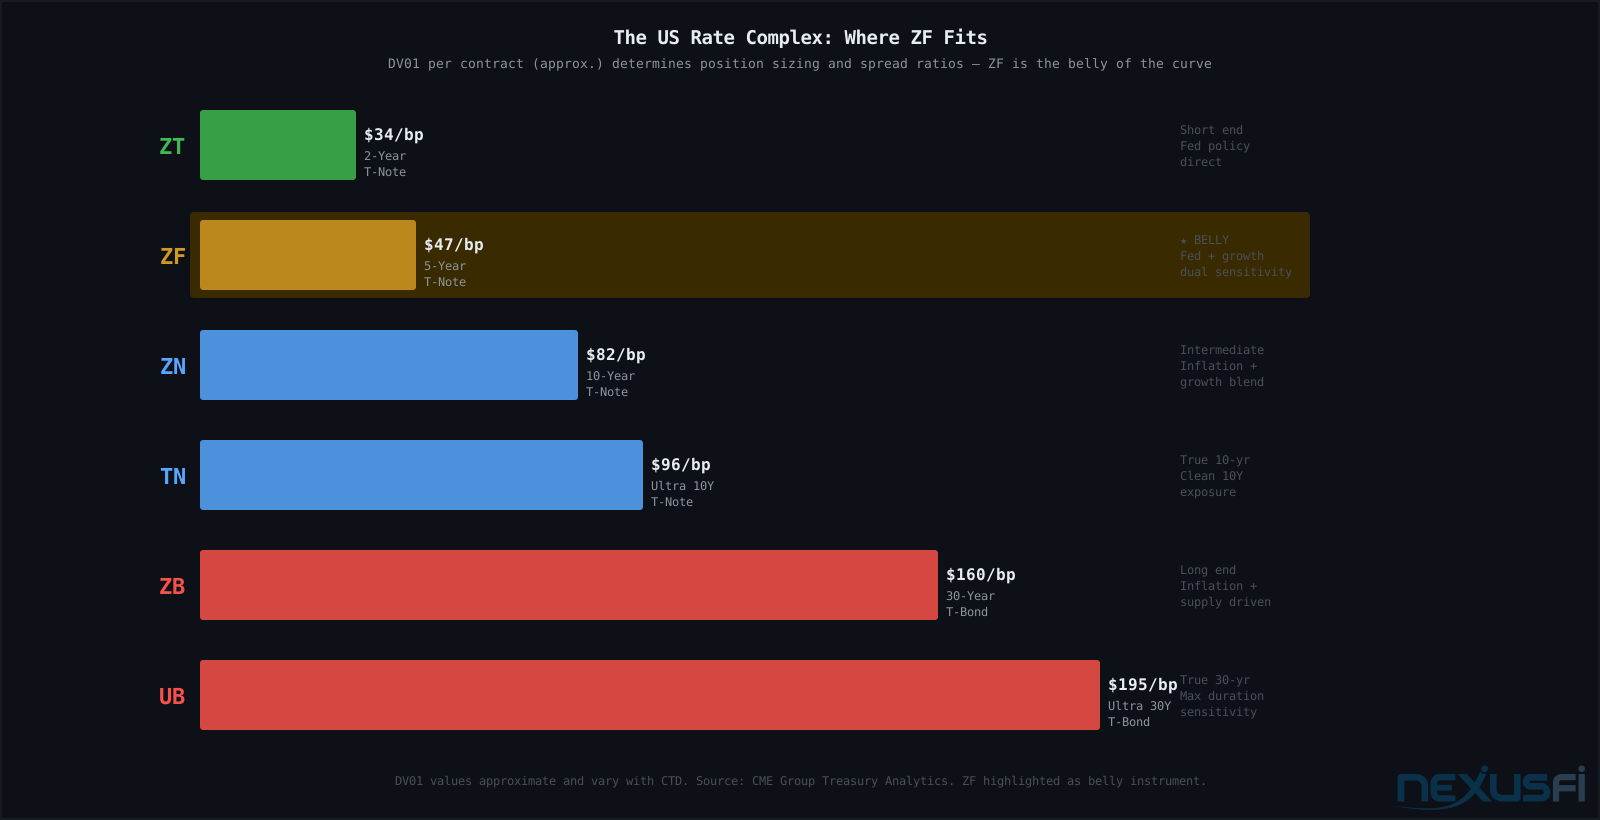
ZF is among the most liquid futures contracts in the world. Daily volume regularly exceeds one million contracts. The underlying $100,000 face value of US Treasury notes with maturities between 4 years 2 months and 5 years 3 months makes each contract represent a significant rate position — but at roughly $47.50 of DV01 (dollar value per basis point), it's more manageable than the longer-duration ZN ($82 DV01) or ZB ($160 DV01) contracts.
What makes ZF interesting isn't just its own dynamics. It's the hinge point for yield curve spread trading. The FYT spread (3 ZF contracts vs. 2 ZN contracts) is one of the most actively traded curve expressions in fixed income. Understanding ZF means understanding how Fed expectations transmit into the rest of the curve — and how to position around that transmission.
Key Concepts #
DV01 (Dollar Value of a Basis Point): The dollar change in a futures contract's value when yields move by one basis point (0.01%). ZF carries approximately $45-50 DV01, versus $80-90 for ZN and $150-170 for ZB. DV01 determines how you size positions and construct duration-neutral spreads.
Yield Curve: The graphical representation of yields across Treasury maturities. The curve's shape — steep, flat, inverted, humped — reflects the market's collective view on growth, inflation, and Fed policy. ZF sits in the 5-year segment, often called the "belly" of the curve.
FYT Spread: The Five-Year/Ten-Year yield curve spread, expressed in futures as 3 ZF vs. 2 ZN (DV01-adjusted ratio). Steepening means 5-year yields fall relative to 10-year yields. Flattening is the opposite.
CTD (Cheapest to Deliver): Treasury futures allow multiple bonds to be delivered. The CTD is the bond that minimizes the short's delivery cost while satisfying contract eligibility. ZF's CTD changes as yields move, which affects the contract's effective duration.
Conversion Factor: A CME-calculated adjustment that makes all deliverable notes approximately equivalent to the notional 6% coupon bond the contract theoretically references. Pricing and delivery mechanics rely on conversion factors.
Bull Flattening: Long-duration yields fall faster than short-duration yields. 5-30 spread compresses. Typically a "flight to quality" or "growth scare" regime. ZF leads the rally in bull flattening environments.
Bear Flattening: Short-duration yields rise faster. Fed is hiking or expected to hike. ZF typically leads lower. The 5-year is most sensitive to near-term Fed expectations — more than the 10-year or 30-year.


Contract Specifications #

| Specification | Details |
|---|---|
| Exchange | CBOT (part of CME Group) |
| Ticker Symbol | ZF (Product Code: FV) |
| Contract Size | $100,000 face value |
| Deliverable | US Treasury Notes, 4y2m to 5y3m remaining maturity |
| Price Quotation | % of par, in increments of 1/32 of 1% |
| Minimum Tick | 1/4 of 1/32 (0.0078125%) = $7.8125 per contract |
| Full Tick (1/32) | $31.25 per contract |
| Trading Hours | Sunday 5:00 PM -- Friday 4:00 PM CT (23 hours) |
| Expiration Cycle | Quarterly: March (H), June (M), September (U), December (Z) |
| Settlement | Physical delivery of eligible Treasury Notes |
| DV01 (approx.) | ~$47.50 per contract per basis point |
Full contract specifications, including delivery schedules and current margin requirements, are published on the CME Group ZF product page. [10]
The tick structure deserves attention. ZF prices in 32nds, and the minimum move is 1/4 of a 32nd — so it takes 4 minimum moves to make one full 32nd ($31.25). Most price changes in ZF happen in 1/2 or full 32nd increments during normal trading. The 1/4 tick is primarily visible in spread markets.


DV01 and Rate Sensitivity #
DV01 is the single most important concept for anyone trading ZF. It tells you exactly how much money you make or lose for every basis point yield change.
For ZF, DV01 runs approximately $45-50 per contract depending on the current CTD bond. That's about half the ZN's DV01 of $80-90, and roughly a third of ZB's $150-170. This relationship drives spread ratios and position sizing.
Here's what this means practically: if the Fed signals an unexpected 25bp hike, and you're long 10 ZF contracts, your theoretical loss is roughly 10 contracts × $47.50 DV01 × 25 bps = $11,875. Compare to holding 10 ZN: $82 × 25 × 10 = $20,500. Same macro event, different rate sensitivity. ZF absorbs rate shocks with less violence than ZN — but also captures less of the rally when rates fall.
The same logic applies to ZF spread construction — the CTD's maturity affects the effective duration, making ZF vs. TN a cleaner 5-10 spread than ZF vs. ZN.


Yield Curve Position: The Belly #
ZF occupies what curve traders call the "belly" of the yield curve. Understanding why that matters requires understanding how different parts of the curve respond to different forces.
The short end (2-year, ZT) is almost entirely driven by Fed expectations. If the market prices in two hikes over the next 12 months, the 2-year yield rises to reflect those expected hikes — and barely reacts to long-term inflation stories because by 2 years, those hikes are already priced in.
The long end (10-year, 30-year, ZN, ZB) is more sensitive to long-term inflation expectations, supply dynamics (Treasury issuance), and flight-to-quality flows. A strong CPI number hits the long end harder than Fed policy changes do.
The belly (5-year, ZF) sits at the intersection of both forces. 5-year yields respond to near-term Fed expectations AND to longer-term growth/inflation views. This dual sensitivity creates a characteristic that makes ZF interesting: it's caught in the middle when the signals diverge.
When the market believes the Fed will hike aggressively but inflation will then collapse (peak-hike scenario), the 5-year typically rallies sharply — the belly "bull flattens" because future rate cuts are priced in before the long end catches up.
The belly flattens faster than either extreme in these transitions. That's both the opportunity and the risk.

Trading Applications #
Directional Rate Trades
The simplest ZF trade is a directional bet on rates. Long ZF = short rates (expecting yields to fall, bond price to rise). Short ZF = long rates (expecting yields to rise, bond price to fall).
Most directional ZF trades are driven by macro thesis: Fed policy path, inflation expectations, growth trajectory. The entry and exit logic follows macro catalysts — FOMC meetings, CPI and PCE prints, NFP releases, Treasury auctions (especially 5-year auctions which most directly impact ZF pricing).
Stop placement: ZF is a macro instrument — discretionary stops work better than technical ones for longer-duration trades. For active intraday work, 4-8 ticks (4-8 × $31.25 = $125-$250 per contract) is typical. For swing trades, sizing down and using wider dollar-based stops is preferable to arbitrary technical levels.
When it fails: ZF directional trades fail when the macro thesis is correct but a different instrument moves more efficiently. During rapid hiking cycles, ZF catches the full DV01 impact but ZT (2-year) moves more violently on each print because the 2-year is more Fed-sensitive. Picking ZF over ZT or ZN depends on WHERE on the curve you want your exposure.
Curve Spread Trading: FYT, FOB, NOB
Curve spreads are ZF's most sophisticated use case — and where serious fixed income traders spend most of their time.
FYT (5-Year/10-Year Spread): The standard ratio is 3 ZF vs. 2 ZN. Why 3:2? Because 3 × $47.50 = $142.50 vs. 2 × $82.00 = $164.00 — approximately DV01-neutral. @s0mmi, a curve trader at an Australian prop firm, laid out the FYT trade mechanics on NexusFi: "This is the chart-book ratio. 3FVA-2TYA. The 5-year note is about a 4.5 year basket duration of bonds... and the T-note is about 7.5 yrs. It's not carrying a lot of duration risk but there is significant movement coming along in the future."
His observation about the intraday FYT behavior across regimes is key: "In 2014, the FYT was grindy all the way through. In 2018, we got a large mean-reversion move — a significant warning shot for the year." When volatility regimes change, the curve spread's intraday behavior changes too. In low-vol environments, the FYT grinds 5-10 tick scalps. In high-vol regimes (Fed actively hiking), it makes 30-50 tick moves and mean-reverts less predictably.
FOB (Fives Over Bonds): ZF vs. ZB spread. The "belly-to-long-end" expression. This captures the difference between 5-year and 30-year positioning — more popular when the long-end is dominated by supply or inflation concerns distinct from short-term Fed expectations.
NOB (Notes Over Bonds): ZN vs. ZB. The standard "10 vs. 30" expression. Uses a 2:1 ratio (roughly DV01-neutral). As @CSC1 noted: "the NOB uses a 2ZN to 1ZB ratio." ZF is frequently used in three-way butterfly spreads: long belly (ZF), short both wings (ZT and ZB).
Practical spread execution: The CME offers exchange-recognized calendar and inter-commodity spreads with dedicated order books. Trading the FYT spread outright through the spread market is preferable to legging in — you eliminate execution risk and get tighter bid/offer. The spread's dedicated book typically offers 1 tick (1/4 of a 32nd) bid/offer, versus 2 ticks of slippage if legging the two contracts separately.


Key Macro Drivers #
FOMC Meetings and Communications: The Fed's policy rate path is the single biggest driver of ZF. Not the current rate — the expected rate path over the next 2-3 years (tracked via Fed Funds Futures). A hawkish pivot (Fed signals more hikes) flattens the 5-10 spread and sends ZF lower. A dovish signal does the opposite. The forward guidance matters more than the immediate decision — a 25bp hike that was 95% priced in moves ZF less than a statement change that reprices the terminal rate.
@s0mmi's warning from his 2018 FYT strategy post still applies: "mega warning for FOMC minutes and FOMC meetings. They are ALL live this year and will be plagued by a change of commentary that will cause vicious moves immediately upon release."
CPI and PCE: Inflation prints directly affect whether the Fed's path extends or shortens. Hot CPI = more hikes priced in = ZF falls. But the reaction in ZF depends on WHERE inflation is — if core services are driving it (wage-push), the 5-year reacts harder because that type of inflation is stickier and requires sustained Fed tightening.
NFP (Nonfarm Payrolls): Strong jobs = Fed can keep hiking = ZF lower. But sensitivity depends on the macro context. In 2022-2023, every hot NFP print hammered ZF. In a post-hike pause regime, NFP's impact on ZF is more muted unless dramatically off-consensus.
Treasury Auctions: The 5-year auction (typically around the 22nd of each month) directly reprices ZF. A "sloppy" auction — poor bid-to-cover, high dealer takedown, tail (auction price below WI level) — signals weak demand and sends ZF lower. Strong auction = rally. Monitor the When-Issued (WI) 5-year yield before the auction as a real-time demand gauge.
@jstnbrg, a former CBOT floor trader, described the dealer pre-hedging dynamic around auctions: "There is a known amount of supply entering the market at a known time... They know they're going to be buying a lot of bonds, so they go into the auction short futures (they pre-hedge, just like grain elevators preparing for overnight grain purchases). Pre hedging in the massive quantities required for today's huge auctions drives down the market." His experience confirms a consistent pattern: selling pressure accelerates in the hour before auction time, followed by a post-auction recovery as dealers unwind inventory. [jstnbrg, 2011, 6 thanks]

Session Characteristics and Volume #
ZF trades 23 hours a day on Globex, but volume is not uniform. Understanding volume distribution matters for execution quality.
Peak liquidity (8:20 AM — 3:00 PM CT): Liquidity peaks around economic data releases (typically 7:30 AM and 10:00 AM CT), FOMC announcements (2:00 PM ET), and Treasury auction times (1:00 PM ET). Volume spikes on data days can produce 50,000-100,000 contracts of ZF volume in the first 5 minutes after CPI release.
Overnight session (5:00 PM CT — 7:00 AM CT): Volume drops much. European session (starting ~2:30 AM CT) adds meaningful liquidity as the German Bund (FGBM on Eurex) trades simultaneously. European fixed income is highly correlated with ZF — Bund moves at 2:30 AM CT often precede ZF directional movement in the US session.
Data day execution: Position yourself before data releases, not into them. The bid/offer spread widens dramatically on data days, and market order slippage can be 4-8 ticks. The difference between a limit order filled at the market before release versus a market order after CPI is typically 3-5 ticks ($93-$156 per contract) in slippage alone.
Roll Mechanics #
ZF expires quarterly. If you hold a position into the delivery period, you face the complexity of the delivery process. For most traders, you roll before delivery begins.
The roll method: use the ZF Sep/Dec calendar spread (or whatever the current quarterly pair is). Selling the calendar spread simultaneously buys back your long September and opens a new long December. This eliminates execution risk versus doing the legs separately.
@Fat Tails explained the mechanics: "The easiest way to roll your short position in ZF is to sell a Sep13/Dec13 calendar spread. Selling the calendar spread means that you are simultaneously buying the ZF Sep13 contract and selling the ZF Dec13 contract. Rolling via the spread should be cheaper than buying back the old contract and selling the new one separately. Also there is no execution risk involved, as the market cannot move against you when you sell the calendar spread."
The calendar spread typically trades at the "carry" value — the net financing cost and income from holding the underlying Treasury note for one quarter. If the spread trades at an unusually wide discount to fair value, there's a statistical edge to positioning the spread in the opposite direction. Experienced ZF roll traders track the CTD and its conversion factor to identify rich/cheap calendar spread pricing.
Technical Analysis for ZF #
ZF is a macro instrument, but it shows definable technical patterns — especially around key yield levels and range breakouts.
Trending behavior: ZF trends persistently during rate cycles. From late 2021 through October 2022, ZF fell nearly 12 points — roughly $37,500 per contract over the cycle. These are not mean-reverting environments for directional traders. The breakout of multi-year support/resistance in yield translates directly to sustained technical momentum.
Mean-reverting behavior: Within the cycle, ZF shows strong mean-reversion tendencies on an intraday and 1-3 day basis. Daily range is typically 6-12 ticks in quiet markets, expanding to 20-40 ticks on data days. Fading 8+ tick intraday moves away from the previous close has positive expected value in neutral macro environments — but this evaporates immediately when a macro trigger strikes.
Round-number yield levels: ZF traders pay attention to round yield levels (4.00%, 4.25%, 4.50%, etc.) mapped to equivalent price levels. These act as psychological support/resistance that frequently coincides with technical chart levels. A breakout above 4.50% in the 5-year yield tends to produce follow-through because it represents a level where institutional positioning shifts.
Bund correlation: The German Bund (FGBM on Eurex) is the primary overnight leading indicator for ZF. The two contracts share roughly 75-85% correlation in yield changes. When the Bund breaks a technical level overnight, ZF frequently follows at the US open. This correlation breaks down during US-specific events (FOMC, NFP) but provides solid directional context for overnight and early-session positioning.
Correlation and Multi-Market Analysis #
ZF's correlations with other markets create both hedging opportunities and risk management complexity.
ZF vs. equities (ES, NQ): The classic risk-on/risk-off correlation. When equity markets sell off on growth fears, money flows into Treasuries (flight to quality), pushing ZF prices up (yields down). This correlation has historically been negative — when ES falls 1%, ZF tends to rise 0.3-0.5%.
Critical caveat: this correlation flips during inflationary regimes. In 2022, both equities and bonds fell simultaneously as rate hikes crushed both asset classes. Blindly fading an ES selloff with a ZF long is dangerous in tightening environments — you get short correlation on both sides.
ZF vs. crude oil (CL): Oil prices affect inflation expectations, which affect rate expectations. Rising CL tends to push ZF lower (yields up) in inflationary regimes. The relationship is indirect and depends heavily on whether the oil move is demand-driven (growth positive, neutral for rates) or supply-driven (inflationary, rates up).
The ES-ZF divergence trade: Professional traders watch for periods where ES rallies but ZF doesn't follow (bonds sell off despite equity strength). This typically signals that the bond market is pricing in more rate hikes than equity traders have discounted — a bearish signal for equities when valuation multiples depend on low rates.
Risk Management for ZF Traders #
Key ZF Sizing Rule Size ZF positions by DV01 risk, not by contract count. A 10-contract ZF position carries roughly $4,750 of exposure per 10bp move — the same size in ZB carries $16,000. Calculate your per-trade risk in basis points first, then divide by the DV01 to determine contract count. This prevents the outsized losses that catch ZB traders who "size like ZF."
Dollar risk per contract: At $47.50 DV01, a 10bp move costs/earns you approximately $475 per contract. A "big" macro event like a hot CPI print can move ZF 20-40 ticks ($625-$1,250 per contract) in minutes. Size so — 1-2 ZF per $100,000 in account value keeps a 25bp adverse move below 2% of capital.
The asymmetry of rate moves: Bond markets fall faster than they rise. When rates spike (bonds sell), the move is typically faster and more violent than rallies. If you're trading ZF long, consider tighter stops than if you're short — longs face the risk of violent, gapping moves around unexpected hawkish data.
Correlation risk in rate spike environments: Liquidity in ZF decreases precisely when you most want to exit during sudden rate shocks. Bid/offer spreads widen from 1 tick to 3-4 ticks. Market impact increases. The actual loss on a forced exit is worse than theoretical DV01 calculations suggest — budget for 2-3 extra ticks of slippage in your worst-case scenarios.
When ZF Fails as a Rate Trade #
Trend days with fundamental catalysts: On days where the Fed surprises the market, ZF can move 1.5-2 points (48-64 ticks) in a single session. Mean-reversion setups, support/resistance, volume profile — all fail in these environments. The macro trigger overrides every technical signal. @s0mmi was explicit: "Every single USA data figure of CPI, GDP and Wage-inflator index will be hot cakes and will carry serious risk if you're too over-committed."
Non-economic rate movements: Treasury market dysfunction — like the March 2020 COVID liquidity crisis or the UK gilt crisis of September 2022 — produces violent, technically inconsistent moves. During such episodes, being flat is the correct position.
Basis blowouts: The relationship between cash Treasury prices and ZF futures prices (the "basis") can widen dramatically during market stress. Hedge funds running basis trades (long cash Treasuries, short ZF futures) can be forced to unwind, creating technical disconnections. During these periods, ZF doesn't accurately reflect rate expectations — it reflects the mechanical unwinding of leveraged positions.
Micro 5-Year Treasury Yield Futures (5YY) #
CME Group launched Micro Treasury Yield futures on August 16, 2021, including the 5YY (Micro 5-Year Treasury Yield). [11] This is a at the core different instrument from ZF — it's cash-settled and references yield directly (not price).
But his cost analysis told the real story: "I got charged a $0.57 one-way commission, so $4.56 for the DV01 equivalent of 1 ZN, which compares to just $1.62 for an actual ZN and $1.67 for ZB, so liquidity and transaction costs are still much better in the Treasuries than the Micro Yield Futures."
His bottom line: "I still prefer using the regular treasury futures for yield spreads." The 5YY is worth using for learning yield-curve dynamics intuitively — price moves in the same direction as yield, which is easier for newcomers — but for active spread trading, ZF's liquidity advantage dominates.
Putting It Together #
ZF is a professional instrument. The people on the other side of your trades are rates desks at major banks, hedge funds running systematic macro strategies, and the Fed itself through open market operations. But that doesn't mean retail traders can't profit from ZF — it means you need to understand the instrument deeply enough to identify when you have a genuine edge.
The available edges are: macro thesis correctness (if you correctly forecast the Fed's path before consensus, ZF is the clean instrument to express it), curve spread precision (the FYT spread is accessible to anyone with a futures account — @s0mmi's research process of going through months of historical data to identify follow-through vs. mean-reversion patterns is available to any trader willing to do the work), and macro hedging (equity traders who hold significant long positions can hedge interest-rate risk using ZF when the correlation is reliably negative).
The instrument demands respect. ZF is not ES. There's no order flow, no footprint, no DOM scalping edge that applies cleanly. Technical analysis works at the macro level (trend following in rate cycles) but fails at the micro level when macro catalysts dominate. Trade it as a macro instrument with defined DV01 risk, and you have one of the most powerful tools in the futures complex.
Know the curve. Know the Fed. Know the CTD. Size for DV01, not for points. Then execute with the precision the instrument demands.
References #
[10] CME Group. 5-Year US Treasury Note Futures Contract Specifications. CME Group, Inc.
[11] CME Group. Micro Treasury Yield Futures. CME Group, Inc. Launched August 16, 2021.
Knowledge Map
Go Deeper
Build on this knowledgeReferences This Article
Articles that build on this topicCitations
- — 2s vs 10s (2022) 👍 3“I built a simple spreadsheet using DV01 data straight from the CME website. The regular ZN 10yr is more like a 7yr due to its broad eligibility for deliverables, so you will get a much cleaner 2s/10s expression by using the TN ultra 10yr.”
- — FOUR more NEW MICROs - Micro Treasury Yield Futures coming 16 Aug 21 (2021) 👍 15“Micro Treasury Yield futures... Four major tenors: 2-Year Note, 5-Year Note, 10-Year Note, and 30-Year Bond. All four contracts are sized at $10 dollar per basis point of yield (0.01%), creating seamless curve spreading opportunities.”
- — General bond / interest rate discussion (2021) 👍 3“ZF | 5 Year Treasury Notes... ZN | 10 Year Treasury Notes (due to delivery requirements I gather this more represents 7yr than 10yr)... TN | Ultra 10 Year Treasury Notes (newer contract, more the true 10 year than ZN).”
- — FOUR more NEW MICROs - Micro Treasury Yield Futures coming 16 Aug 21 (2021) 👍 3“The fixed $10 DV01 will allow for a much higher degree of precision for duration-neutral curve expressions (no more squirrely hedge ratios or convexity adjustments).”
- — FOUR more NEW MICROs - Micro Treasury Yield Futures coming 16 Aug 21 (2021) 👍 2“The DV01 on these micro contracts is ten dollars, whereas the 10yr note contract is around $82, a ratio of approximately 8:1.”
- — S0mmi FYT strategy (2018) 👍 22“The U.S. yield curve is going to have a lot of play this year. Important: Every FOMC meeting this year is LIVE and will have potential for large commentary changes that reprice the terminal rate.”
- — 5 year note futures ZF (2013) 👍 5“The easiest way to roll your short position in ZF is to sell a Sep13/Dec13 calendar spread. If your front month position gets auto-rolled by your broker, you will often be rolled into the wrong contract.”
- — ZF 5yr notes - looking for a pivot high (2015) 👍 4“short-term treasuries track what the fed does with interest rates, and longer maturity notes and bonds are affected more by longer term expectations of inflation and the economy.”
- — General bond / interest rate discussion (2022) 👍 8“When someone like Blackrock, with their nearly $2 trillion in fixed income assets, needs to adjust their duration exposure, they need a lot of liquidity. ZF and ZN are typically where large institutions go.”
- CME Group — Five-Year U.S. Treasury Note Futures - Contract Specifications (2026)
- CME Group — Micro Treasury Yield Futures - Product Overview (2026)