



30-Year Treasury Bond (ZB) Futures: The Complete Trading Guide
Overview #
The 30-Year US Treasury Bond futures contract — ticker ZB on CME's CBOT exchange — is the apex predator of the US rate complex. When you're in ZB, you're in the instrument that most directly expresses long-term inflation expectations, Treasury supply dynamics, and flight-to-quality flows. It's not a Fed-policy contract the way the 2-year (ZT) is. It's not a "belly" instrument like the 5-year (ZF). ZB is the long end, pure and simple — and everything about how you trade it reflects that reality.
ZB was launched in 1977 as one of the first financial futures contracts at the Chicago Board of Trade. Before it existed, bond traders had no way to hedge their inventory without physically delivering billions in bonds. ZB changed that. For nearly five decades, it's been the instrument that pension funds, insurance companies, mortgage servicers, and macro hedge funds use to manage their most consequential rate exposures.
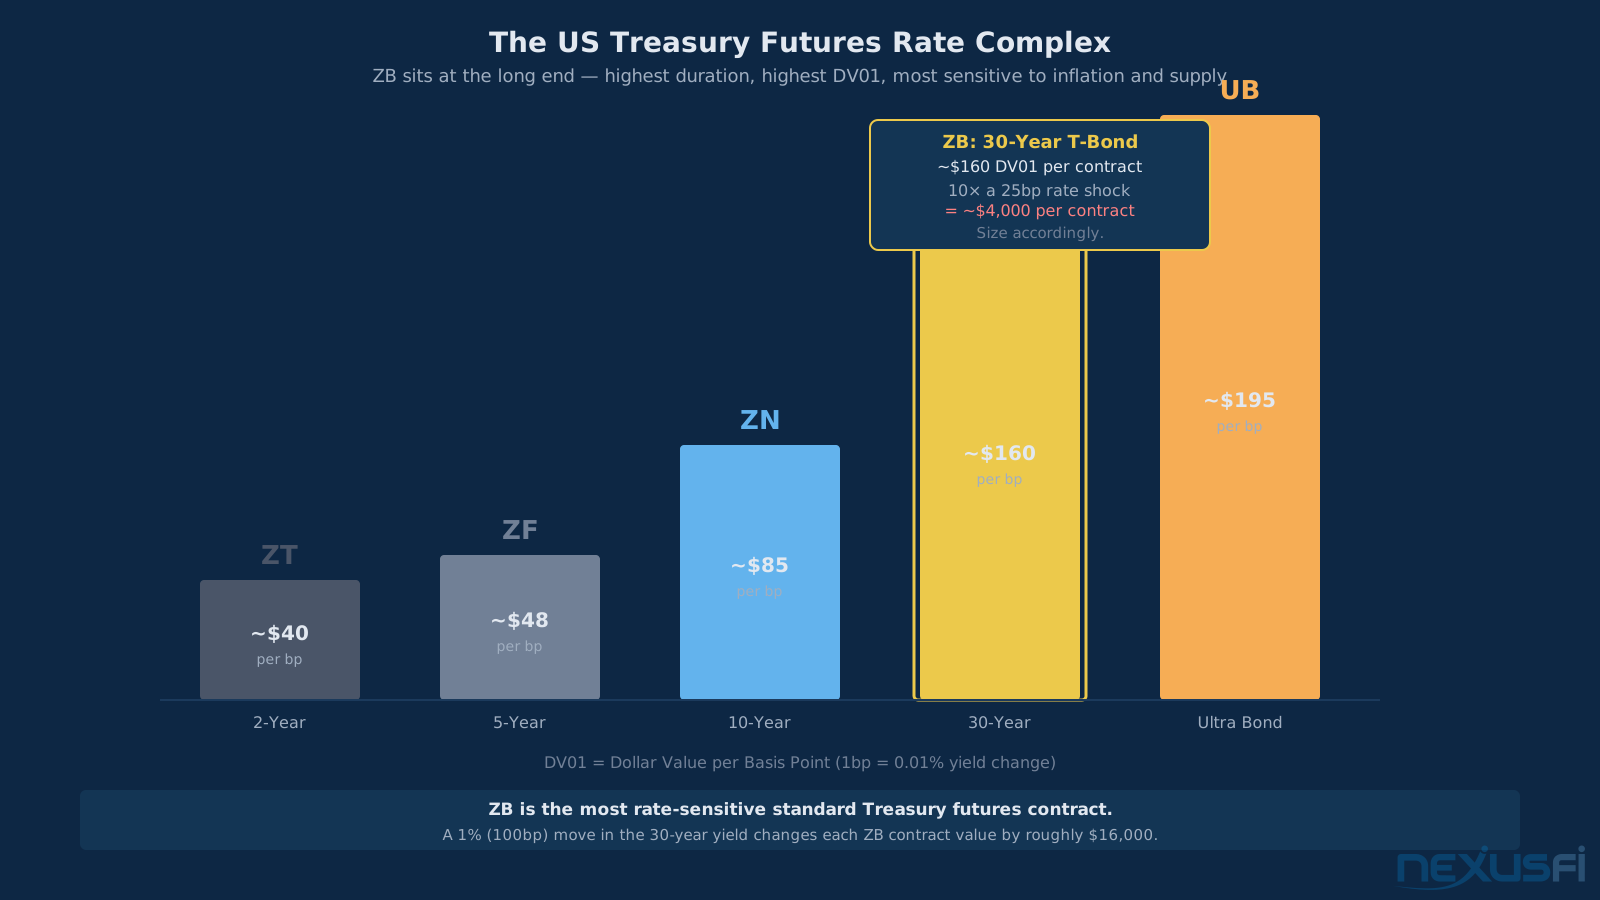
With a DV01 (dollar value of a basis point) of approximately $150-170 per contract, ZB carries nearly twice the rate sensitivity of the 10-year note futures (ZN) and over three times the ZF. A 10bp move in the 30-year yield means $1,500-1,700 per contract. A surprise CPI print that moves the long end 20-30bp? That's $3,000-5,000 per contract, in minutes. You can't trade ZB the way you trade ES or NQ. It demands a different framework entirely.
As of February 2026, ZB open interest reached a record 3.6 million contracts simultaneously with records across the entire Treasury curve — evidence that institutional participation in the long end sits at a structural high. Record open interest across every Treasury tenor, from ZT to ZB, confirms that institutions are actively using futures for rate risk management at an record-level scale.[1] That liquidity creates genuine opportunities for traders willing to understand what drives the long end.
Key Concepts #
DV01 (Dollar Value of a Basis Point): The dollar change in a contract's value for a one basis point (0.01%) yield change. ZB runs approximately 0-170 DV01 depending on the cheapest-to-deliver bond. This is the single most important number in ZB — use it for position sizing, spread construction, and risk management.
Cheapest to Deliver (CTD): ZB allows delivery of multiple eligible Treasury bonds (minimum 15 years remaining maturity, non-callable for 15+ years). The short position always delivers the bond that minimizes their cost. When the CTD changes after a major yield move, ZB's effective DV01 shifts with it.
NOB Spread (Notes Over Bonds): The most widely-traded curve expression using ZB. Long 2 ZN, short 1 ZB (approximately DV01-neutral: 2 × = 0 vs. 1 × 0 = 0). The NOB reflects the slope of the 10-to-30 yield curve segment — you're not taking direction, you're taking the curve.
Bear Steepening / Bull Flattening: The two regime phrases you'll hear constantly around ZB. Bear steepening = long-end yields rise faster than short-end = ZB falls relative to ZN (buy NOB). Bull flattening = long-end yields fall faster = ZB rallies relative to ZN (sell NOB). Know which regime you're in before every trade.
Contract Specifications #
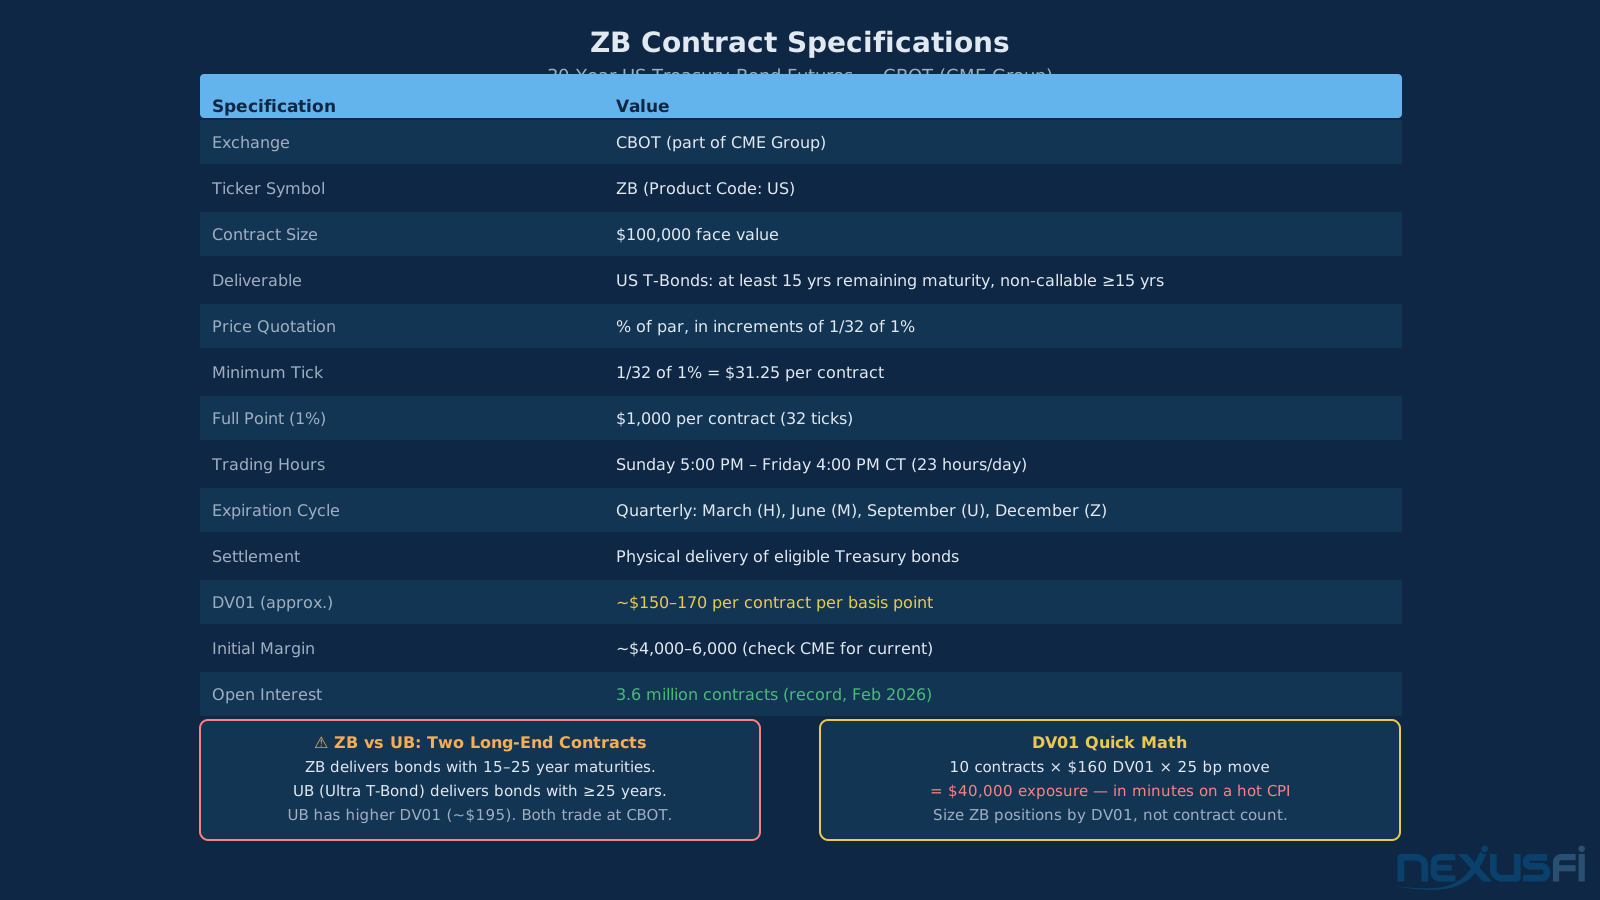
| Specification | Details |
|---|---|
| Exchange | CBOT (part of CME Group) |
| Ticker Symbol | ZB (Product Code: US) |
| Contract Size | $100,000 face value |
| Deliverable | US Treasury bonds: at least 15 years remaining maturity, non-callable ≥15 years |
| Price Quotation | % of par, in increments of 1/32 of 1% |
| Minimum Tick | 1/32 of 1% = $31.25 per contract |
| Full Point (1%) | $1,000 per contract (32 ticks) |
| Trading Hours | Sunday 5:00 PM -- Friday 4:00 PM CT (23 hours/day) |
| Expiration Cycle | Quarterly: March (H), June (M), September (U), December (Z) |
| Settlement | Physical delivery of eligible Treasury bonds |
| DV01 (approx.) | ~$150--170 per contract per basis point |
| Initial Margin | ~$4,000--6,000 (check CME for current requirements) |
The 1/32 tick structure means ZB prices are quoted in unusual fractions. "152-16" means 152 and 16/32 of par — equivalent to 152.50% of face value, or $152,500 per contract. "152-16+" sometimes appears in quotes to denote 152 and 16.5/32 — the "+0" indicates half a 32nd. On the Globex electronic platform, prices are shown as decimals (152.5000), which is cleaner for mental arithmetic.
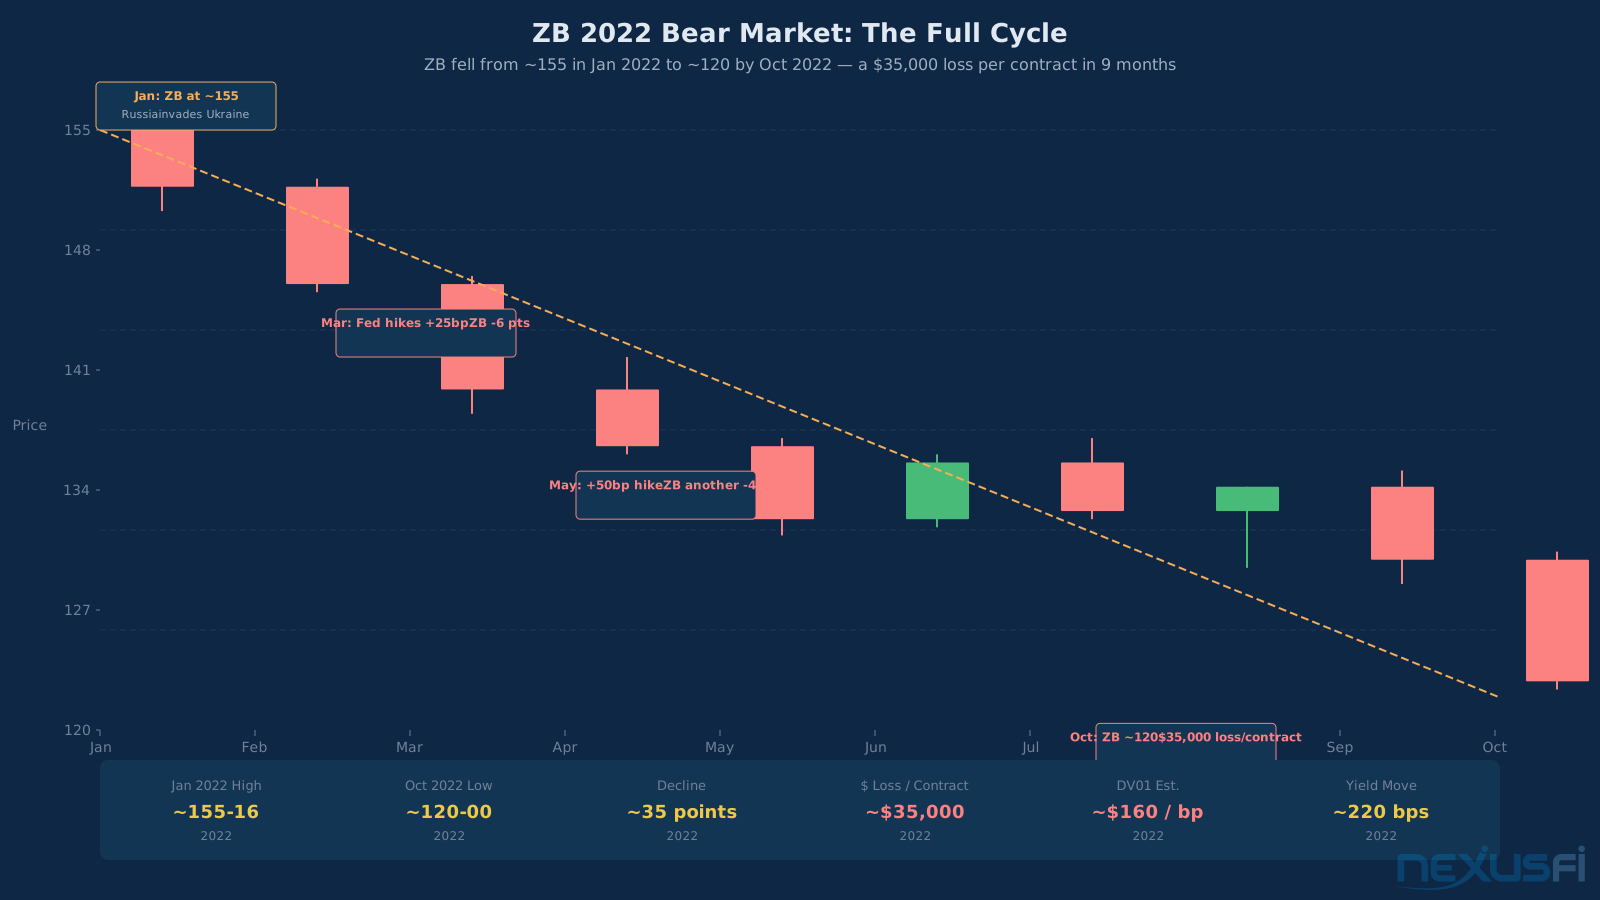
One full point (from, say, 152-00 to 153-00) equals $1,000. Most active intraday traders measure moves in ticks (1/32 = $31.25) or half-points ($500). Swing traders count full points. The 2022 rate cycle produced a 35-point decline in ZB — $35,000 per contract over nine months.
DV01 and Duration: Sizing the Beast #
If you take only one concept from this article, make it this: ZB's DV01 of roughly $160 per basis point makes it at the core different from every other instrument most traders have experience with. Compare:
- ZT (2-Year): ~$40 DV01. One 25bp rate shock = ~$1,000 per contract.
- ZF (5-Year): ~$48 DV01. One 25bp rate shock = ~$1,200 per contract.
- ZN (10-Year): ~$85 DV01. One 25bp rate shock = ~$2,125 per contract.
- ZB (30-Year): ~$160 DV01. One 25bp rate shock = ~$4,000 per contract.
- UB (Ultra Bond): ~$195 DV01. One 25bp rate shock = ~$4,875 per contract.
@rleplae nailed the contrast: "CL is a F16 jet plane, ZB is a jumbo ocean carrier." [3] Crude oil moves faster tick-for-tick. ZB kills slowly and inexorably across a sustained rate cycle.
The practical implication: if you're accustomed to trading ES or NQ where a 10-point move is $500-$1,000, don't make the mistake of treating ZB's point value as equivalent. A 1-point move in ZB is $1,000. The 2022 bear market produced a 35-point decline — $35,000 per contract. That's not an abstract risk warning. It happened over nine months.
What Drives ZB: The Long-End Playbook #
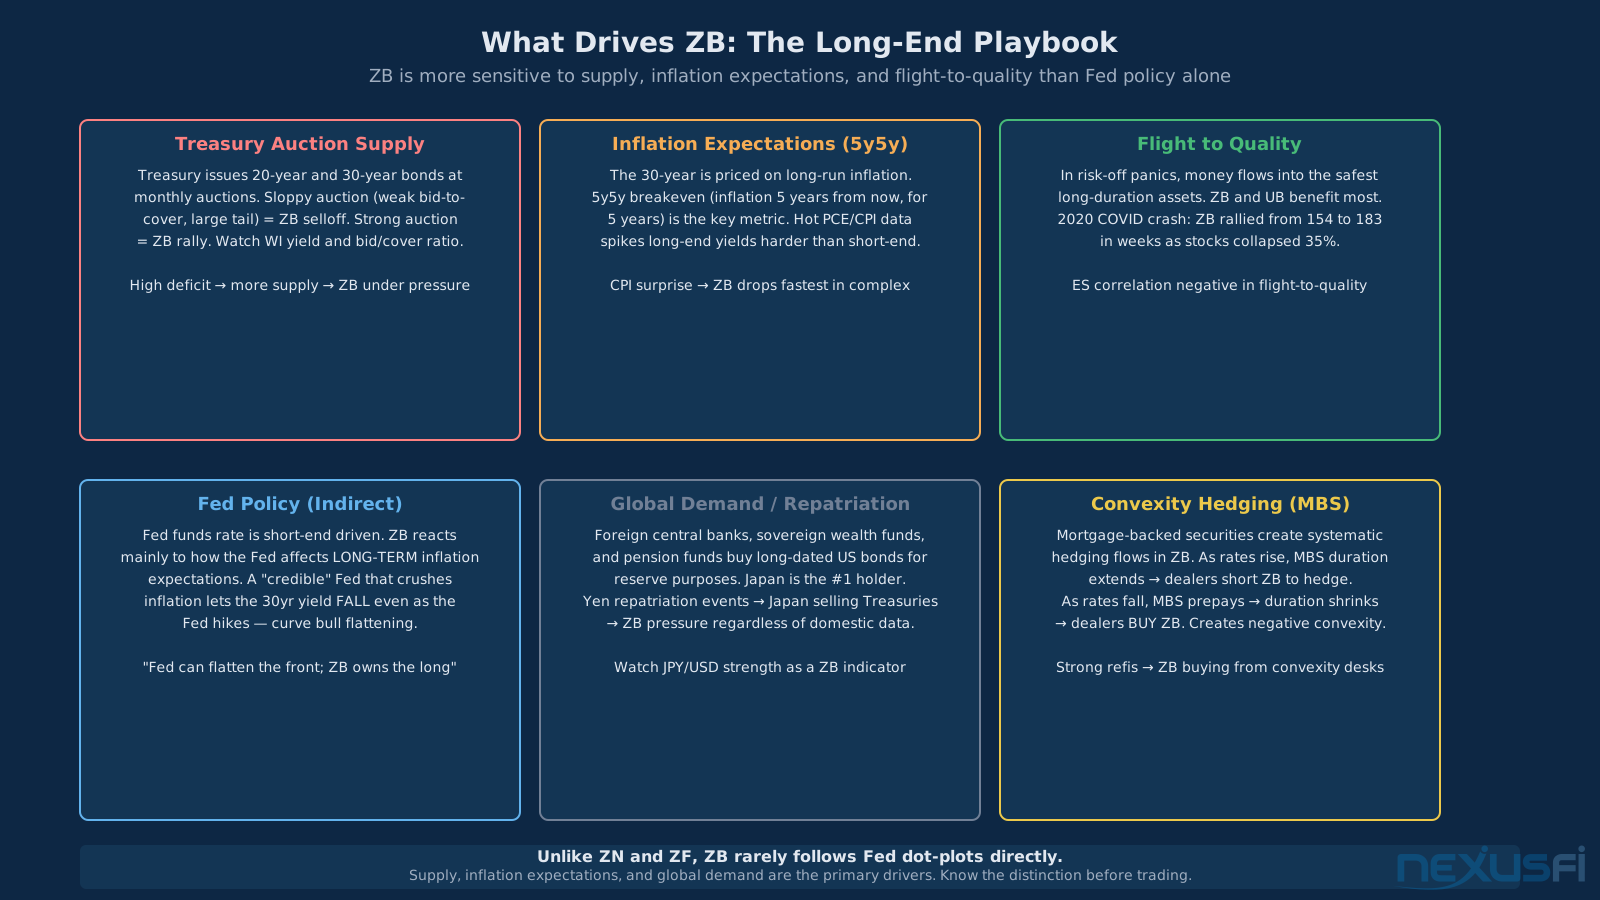
Understanding ZB requires understanding that it's NOT primarily a Fed-policy instrument. The Federal Reserve sets short-term interest rates. ZB prices long-run inflation expectations, Treasury supply, and global demand for safe long-duration assets. These are different variables, and conflating them is the most common mistake new ZB traders make.
Treasury Auction Supply
The US Treasury issues 20-year bonds (roughly monthly, third Wednesday) and 30-year bonds (monthly, fourth Thursday). When auctions come with heavy supply relative to demand, ZB sells off. When demand is strong and the auction "stops through" (final price better than the When-Issued yield), ZB rallies.
Monitoring the bid-to-cover ratio (higher = stronger demand) and the "tail" (the difference between the auction yield and the pre-auction WI yield — positive tail means worse-than-expected results) are the two most direct auction health metrics. A tail of 1-2 basis points is concerning. A tail of 3+ basis points with low bid-to-cover is a significant bearish signal for ZB.
The fiscal deficit matters too. @tigertrader — who spent 30 years trading bonds on the floor of the CBOT — noted the supply dynamic during the 2020 COVID crisis: "Before the COVID crisis hit, the Fed's plan was to pay down $56BB in debt next quarter. Instead they will borrow close to $3TT, so yes that's a lot of supply. And, the demand for bonds has been more in corporates than governments, so treasuries have been quite stagnant. Also, the magnitude of long-end issuance was greater than anticipated, and is the reason why you are seeing a bear steepening in the 5/30." [4]
Long-Run Inflation Expectations (5y5y Breakeven)
The 30-year yield is ultimately a bet on where inflation will average over the next three decades. When markets believe the Fed will successfully anchor long-run inflation near 2%, 30-year yields stay low. When they worry about structural inflation (energy transition costs, deglobalization, persistent deficit spending), the 30-year yield rises to compensate investors for the expected loss in purchasing power.
The metric to watch is the 5y5y forward inflation breakeven rate — the market's estimate of average inflation 5 years from now, over the subsequent 5 years. When this rises, ZB feels it harder than any other Treasury futures contract. A hot CPI print that also moves the 5y5y breakeven higher is a double bearish signal for ZB.
Flight to Quality
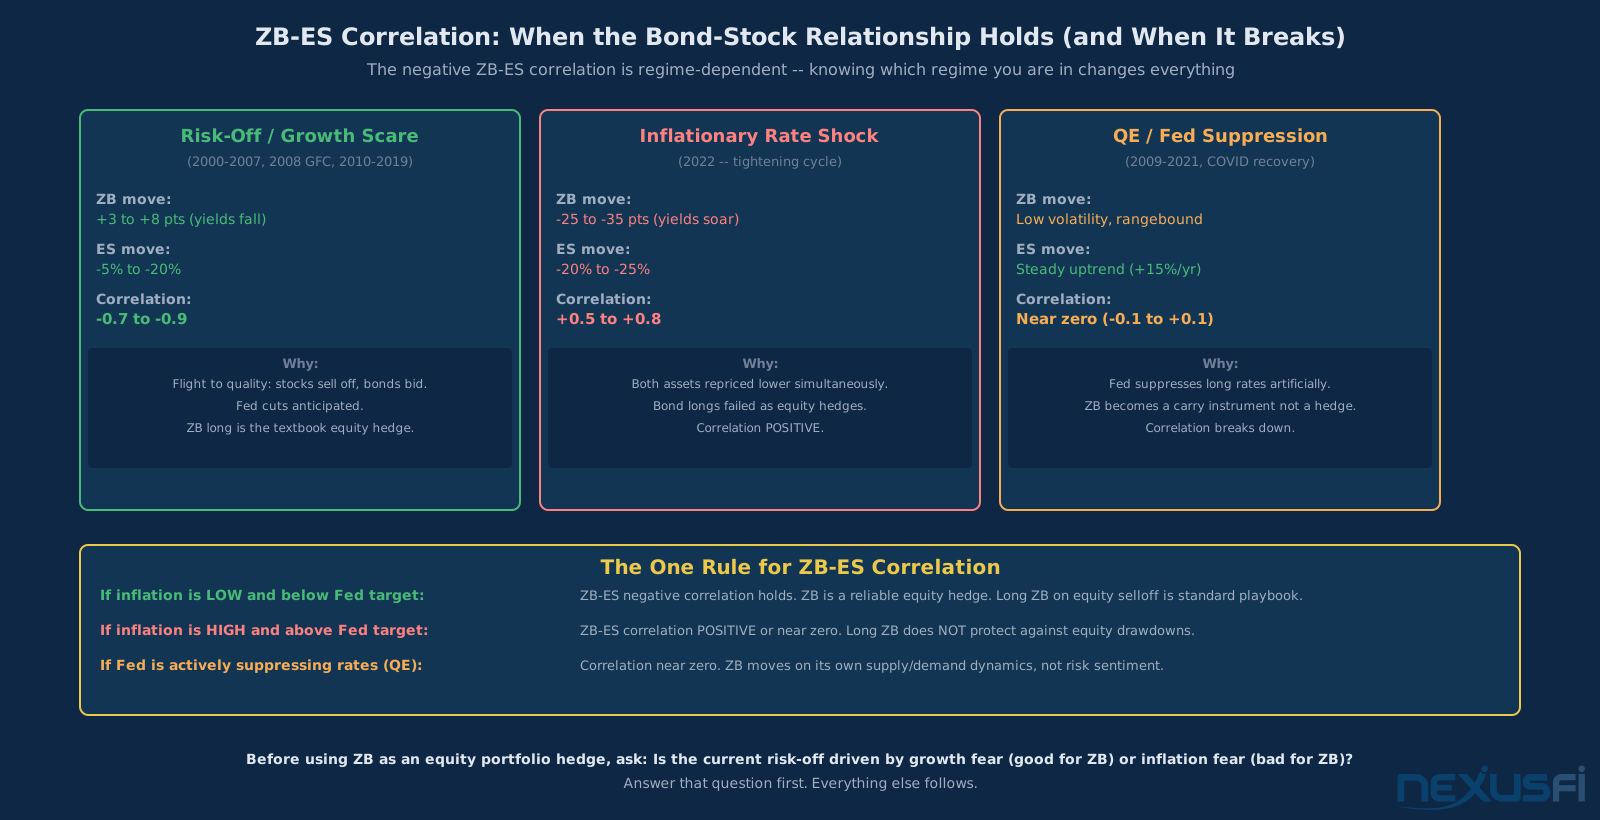
In genuine risk-off events — geopolitical shocks, financial system stress, growth panics — money floods into the safest long-duration assets. ZB and UB benefit most because they represent the deepest, most liquid safe-haven expression in fixed income. The COVID crash in March 2020 saw ZB rally from roughly 154 to 183 in weeks, even as the Fed was cutting aggressively — long bonds rallied because the flight-to-quality bid overwhelmed everything else.
This creates the ZB trader's core skill: distinguishing between risk-off moves that will trigger flight-to-quality buying (good for long ZB) versus risk-off moves driven by inflation fears (bad for ZB, since inflation erodes long-bond value). The COVID crash was deflationary — good for ZB longs. An oil price spike driven by supply disruption is inflationary — bad for ZB longs.
Trading Applications #
Directional Rate Trades
The most straightforward ZB trade is a directional bet on the 30-year yield: long ZB expects yields to fall (bond price rises), short ZB expects yields to rise (bond price falls). Most directional ZB trades are macro-thesis driven — inflation expectations, supply dynamics, Fed credibility, or global demand flows.
Entry and exit logic for directional ZB trades typically follows macro catalysts: Treasury auction results, CPI and PCE data, FOMC communications (especially on their inflation-fighting credibility), and global risk-off/risk-on shifts. Technical levels in ZB do work as entry refinements, but the primary driver must be macro.
@tigertrader warned directly: shorter time frames in ZB mean fighting low-latency algos with zero edge, strategies that get gamed in days, and returns capped by the methodology itself. His recommendation: increase your time frame until the signal-to-noise ratio improves. [5]
The NOB Spread
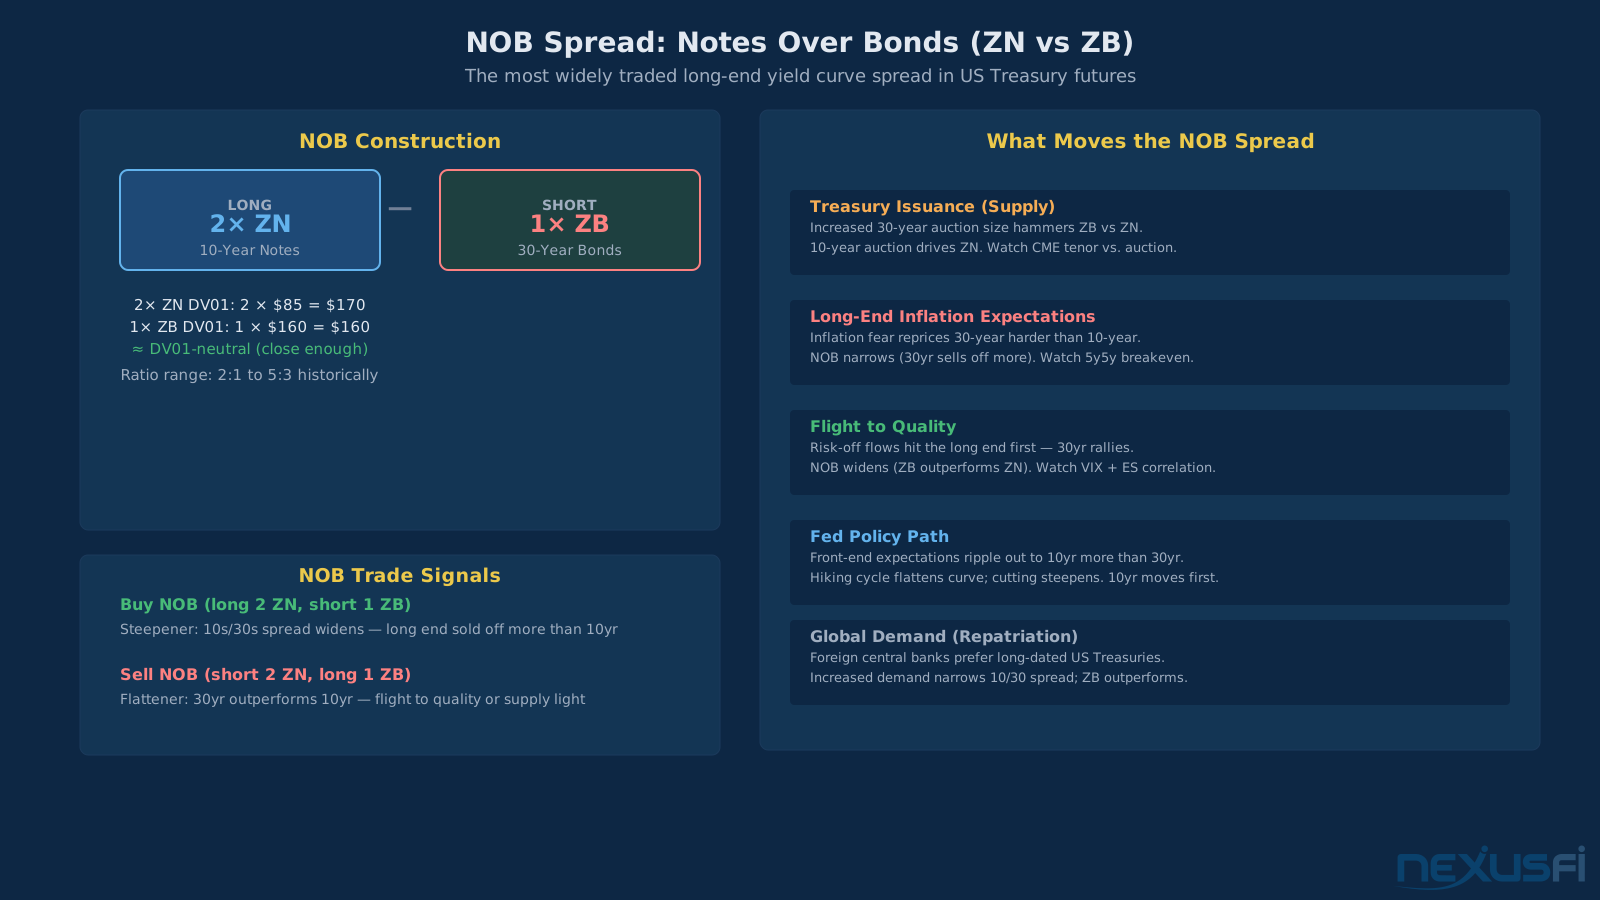
The NOB (Notes Over Bonds) spread is ZB's most sophisticated institutional application. By going long 2 ZN and short 1 ZB (or the reverse), you isolate the slope of the 10s/30s yield curve segment without taking pure directional rate exposure.
The NOB steepens when the 30-year yield rises faster than the 10-year (buy ZN, sell ZB — buy the NOB). It flattens when the 30-year falls faster or the 10-year rises faster (sell ZN, buy ZB — sell the NOB). The primary drivers of the 10/30 slope:
- Heavy long-end supply: Treasury issuing more 30-year bonds → bear steepening → buy NOB
- Inflation fear: Inflation concerns spike the long end → bear steepening → buy NOB
- Flight to quality: Risk-off rallies long end more → bull flattening → sell NOB
- Fed rate hikes: Hiking flattens the curve → front end rises → sell NOB (but complex)
Session Characteristics and Volume #
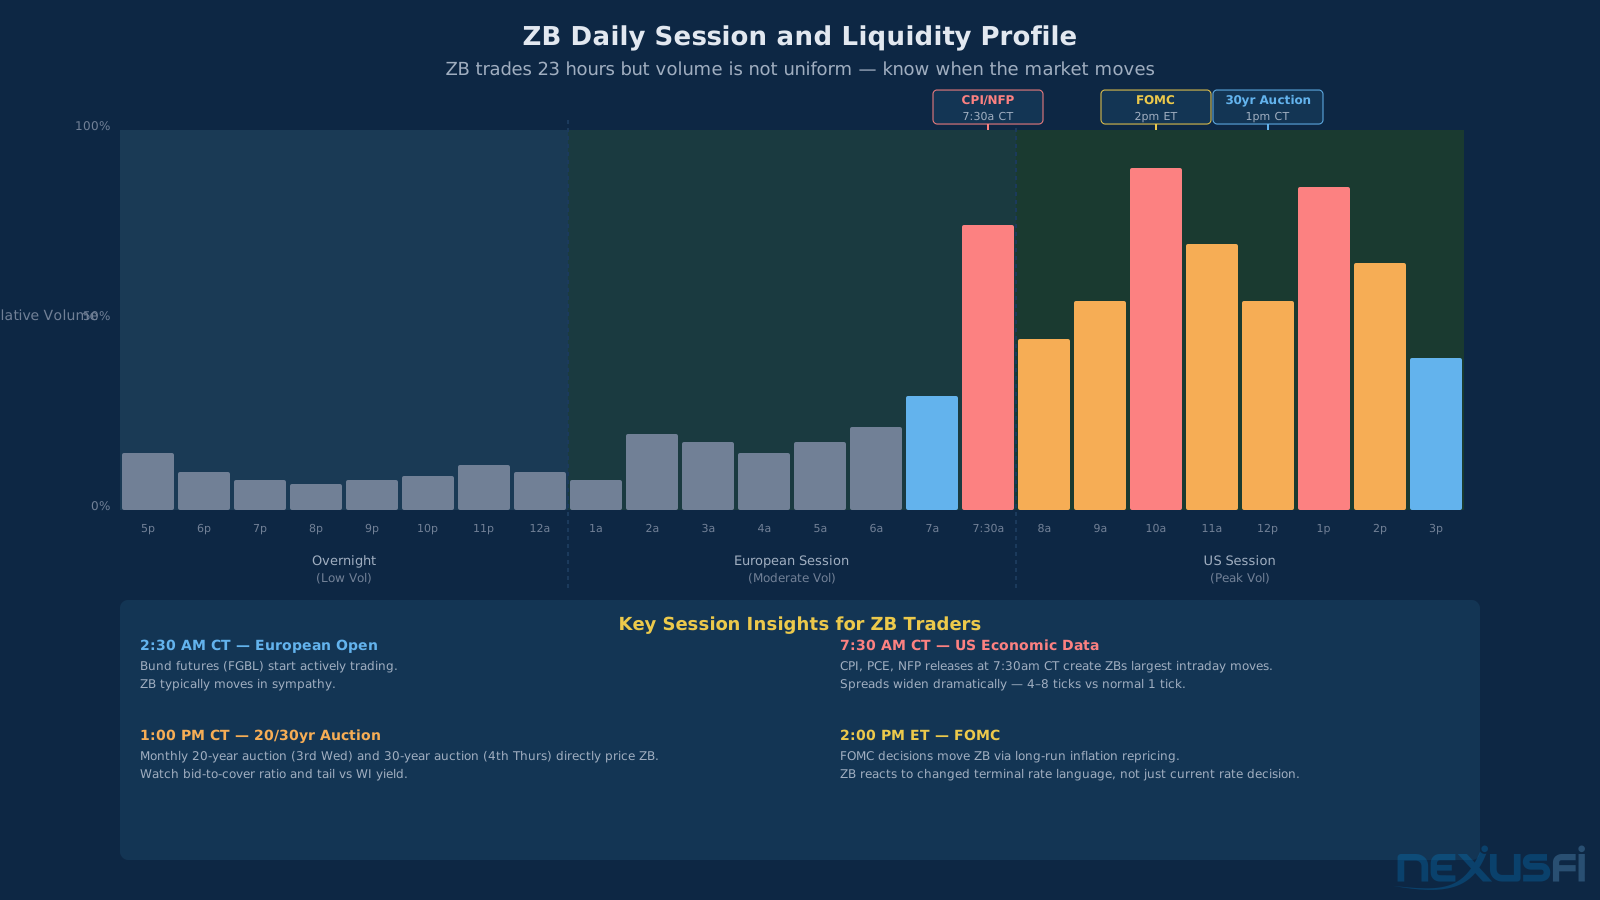
ZB trades 23 hours a day, but knowing WHERE the volume concentrates is essential for execution quality and expected move sizing.
Within that 23-hour window:
- Overnight (5 PM -- 2 AM CT): Minimal volume. ZB tracks global risk sentiment but with thin books. Spreads widen much. This is when sudden overnight events (geopolitical surprises, Asian central bank announcements) move ZB in an illiquid vacuum.
- European Session (2:30 AM -- 7:00 AM CT): Volume picks up as the German Bund (FGBL on Eurex) begins trading. ZB and Bund are highly correlated -- Bund moves frequently precede ZB moves at the US open. Watch the Bund as a real-time leading indicator for ZB.
- US Session (7:30 AM -- 3:30 PM CT): Peak volume. ZB's biggest moves happen around 7:30 AM CT economic releases (CPI, PCE, NFP), Treasury auction results (typically 1:00 PM CT), and FOMC announcements (2:00 PM ET). On CPI days, ZB can move 30-50 ticks ($937-$1,562 per contract) in the first 30 seconds post-release.
@wshi88 runs a morning ZB setup with 6-tick stops, retracement entries to the 20/50 EMA, and session VWAP as reference. [11] That 6-tick stop (7.50) is workable in quiet sessions but gets blown out in seconds on CPI day — session timing matters as much as setup.
Key Macro Events: The ZB Calendar #
CPI (Monthly, 8:30 AM ET): The single most important ZB release. Hot CPI = inflation fears = 30-year yields spike = ZB falls. The long end is most exposed because inflation erodes a 30-year fixed income stream more than any shorter maturity. Plan for 20-40 tick moves on every CPI day.
PCE Deflator (Monthly, 8:30 AM ET): The Fed's preferred inflation metric. Less market-moving day-of, but the month-over-month core PCE trend shapes the long-run ZB directional bias.
30-Year Treasury Auction (Monthly, 1:00 PM ET): The most direct ZB trigger outside inflation data. Bid-to-cover ratio and the tail versus WI yield determine post-auction direction. Sloppy auctions (high dealer takedown, negative bid-to-cover) typically produce 10-20 tick selloffs immediately on release.
FOMC: ZB responds most to the dot plot and language about the neutral rate or inflation tolerance. Even a fully-priced hike can hammer ZB if language signals a higher terminal rate. Conversely, inflation-confidence language produces violent ZB rallies even on hike days.
Nonfarm Payrolls: Strong jobs confirm the hiking path in high-inflation regimes (bearish ZB). In post-hike low-inflation environments, the reaction is more complex and often muted in ZB.
Roll Mechanics #
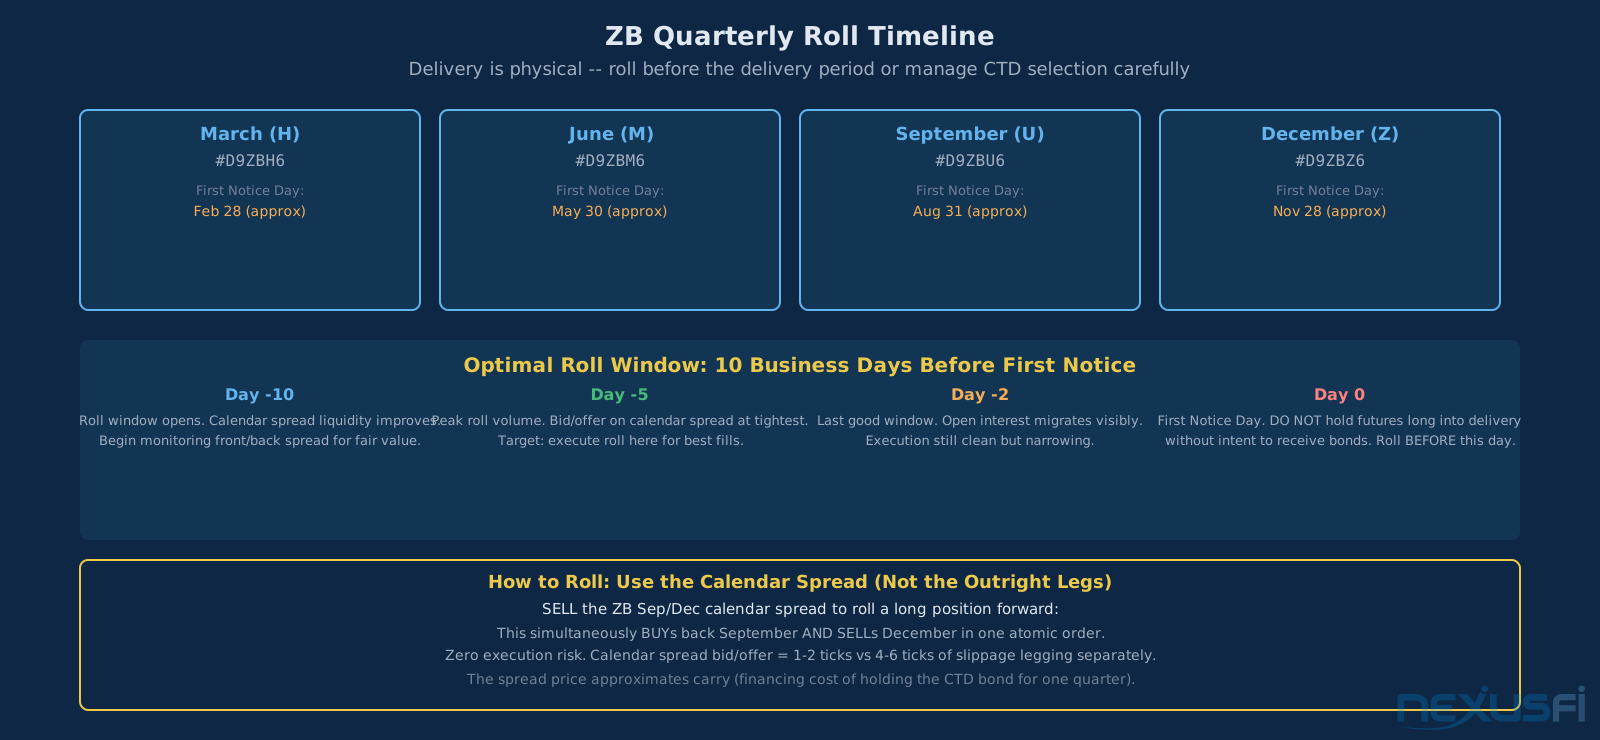
ZB expires quarterly (March H, June M, September U, December Z). Delivery is physical — if you hold past the first delivery notice date, you must deliver or take delivery of actual Treasury bonds. Roll before that date using the exchange-recognized ZB calendar spread, not by legging individually.
The calendar spread (e.g., ZBU6/ZBZ6) prices near carry — the net financing cost of holding the underlying Treasury bond for one quarter minus coupon income. Roll activity concentrates in the two weeks before the delivery period. Bid/offer on the calendar spread tightens to 1-2 ticks during the peak roll window, making it cheap to execute.
The standard check: first notice day falls approximately on the last business day of the month preceding contract expiry. Check CME's published delivery schedule before every roll — dates shift slightly by quarter.
Technical Analysis for ZB #
ZB is a macro instrument, but it forms tradeable technical patterns — especially when the macro environment provides a clear directional bias.
Trending behavior (rate cycles): ZB trends persistently during rate hiking and easing cycles. The 2022 bear market took ZB from roughly 155 in January to roughly 120 in October — a 35-point decline. During sustained trending environments, breakout and momentum strategies outperform. Support/resistance breaks in ZB price translate to yield level breaks; a clean breakout above 4.5% in the 30-year yield tends to produce follow-through because it represents a level where institutional positioning shifts meaningfully.
Mean-reverting behavior (range environments): Between rate cycles, ZB trades in defined ranges and shows strong intraday mean-reversion tendencies. Daily range in low-volatility environments is typically 10-20 ticks ($312-$625 per contract). Fading 15+ tick moves away from the prior session's close has historically positive expectancy in range environments — but this strategy gets absolutely crushed when a macro trigger strikes.
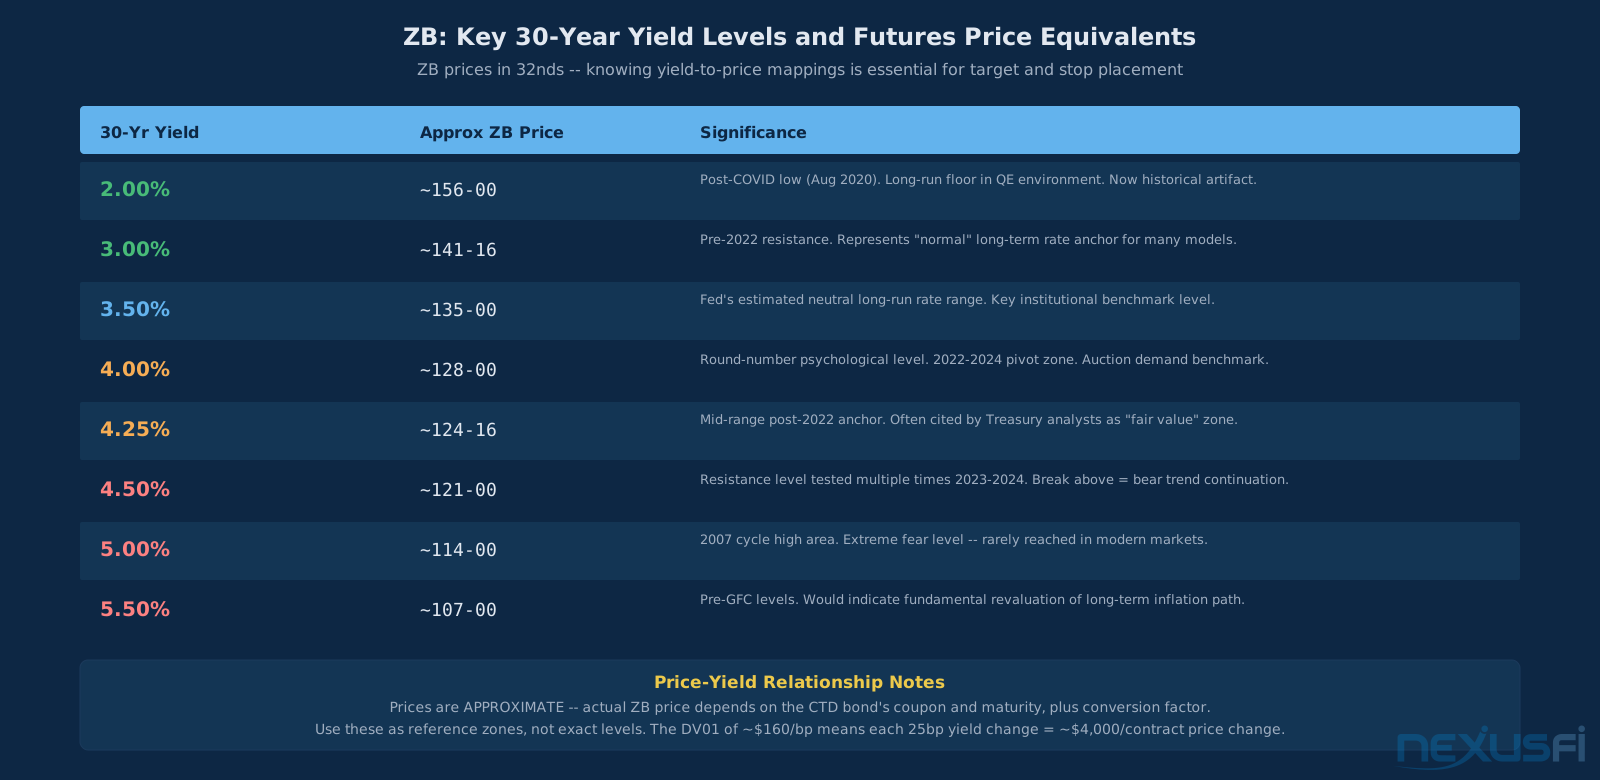
Round yield levels as price anchors: ZB traders pay close attention to round-number yield levels (4.00%, 4.25%, 4.50%, 5.00%) converted to equivalent futures prices. These create psychological support/resistance that often aligns with chart levels. When the 30-year yield breaks a round number with volume, the next 10-15bp of movement often follows quickly as systematic strategies pile in.
Bund as leading indicator: The German Bund (FGBL on Eurex) and ZB share roughly 70-80% yield correlation in normal environments. When Bund breaks a technical level overnight, ZB frequently follows at the US open. This is especially useful for ZB traders who start before 7 AM CT — the Bund's overnight session provides directional clues.
Position Sizing: DV01-Based Risk Management #
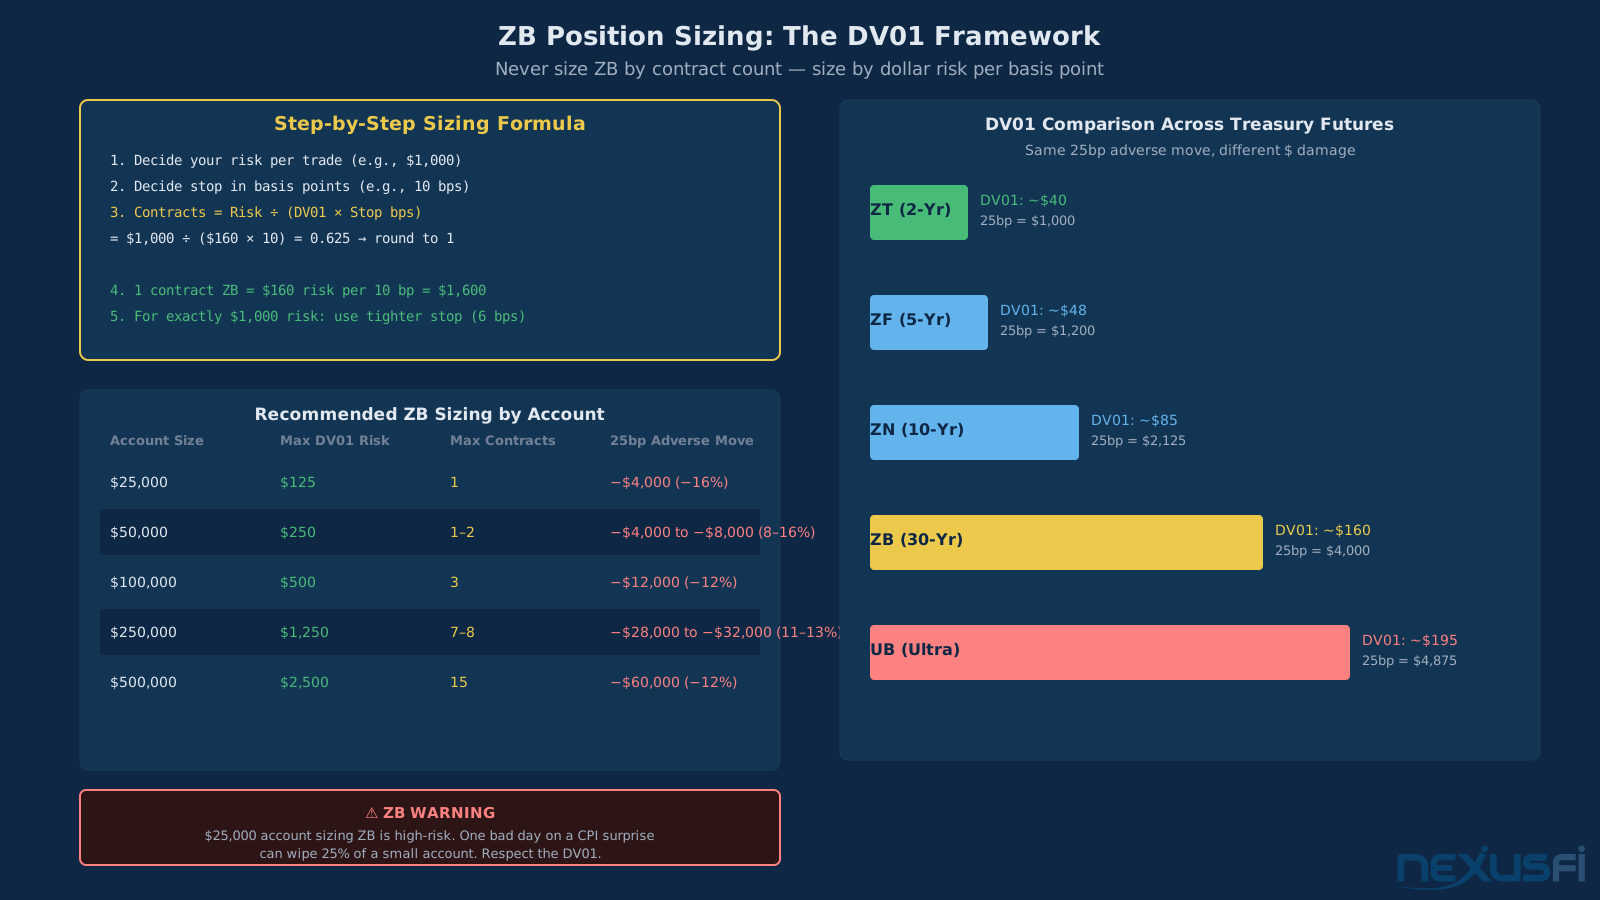
ZB Sizing Rule Calculate ZB position size using DV01 math: Contracts = (Risk per trade) ÷ (DV01 × Stop in bps). At $160 DV01, a 10bp stop on 1 contract = $1,600 risk. Size ZB positions by basis points of yield risk, not by tick count or contract count alone. A "tight" 6-tick stop in ZB is only 6 × $31.25 = $187.50 — in a normal environment, that gets hit routinely. 10bp stops ($1,600 risk/contract) are more realistic for intraday swing trades.
@tigertrader gave the capital requirement guideline directly: "If you're going to be trading 10 lots in the Bonds, you should have at least a hundo in your account." That's $100,000 for 10 ZB contracts — $10,000 per contract, or roughly 6-7× initial margin. The margin requirement exists to cover a catastrophic daily move. The $10k per contract buffer exists to survive the normal grinding of a position against you across multiple sessions. [12]
Practical sizing rules by account size:
- $25,000 account: Maximum 1 contract. A 25bp adverse move = ~$4,000 = 16% of account. ZB is marginal at this account size.
- $50,000 account: 1-2 contracts. 25bp adverse move = $4,000-8,000 = 8-16%. Workable with discipline.
- $100,000 account: 3 contracts. 25bp adverse move = ~$12,000 = 12%. Standard for serious ZB traders.
- $250,000 account: 7-8 contracts. Professional-grade sizing with meaningful P&L impact.
The rule of thumb: never risk more than 2% of your account on a single ZB trade. Calculate backward from 2% to determine your maximum DV01 exposure, then divide by $160 to get your maximum contract count.
ZB vs UB: Choosing Your Long-End Contract #
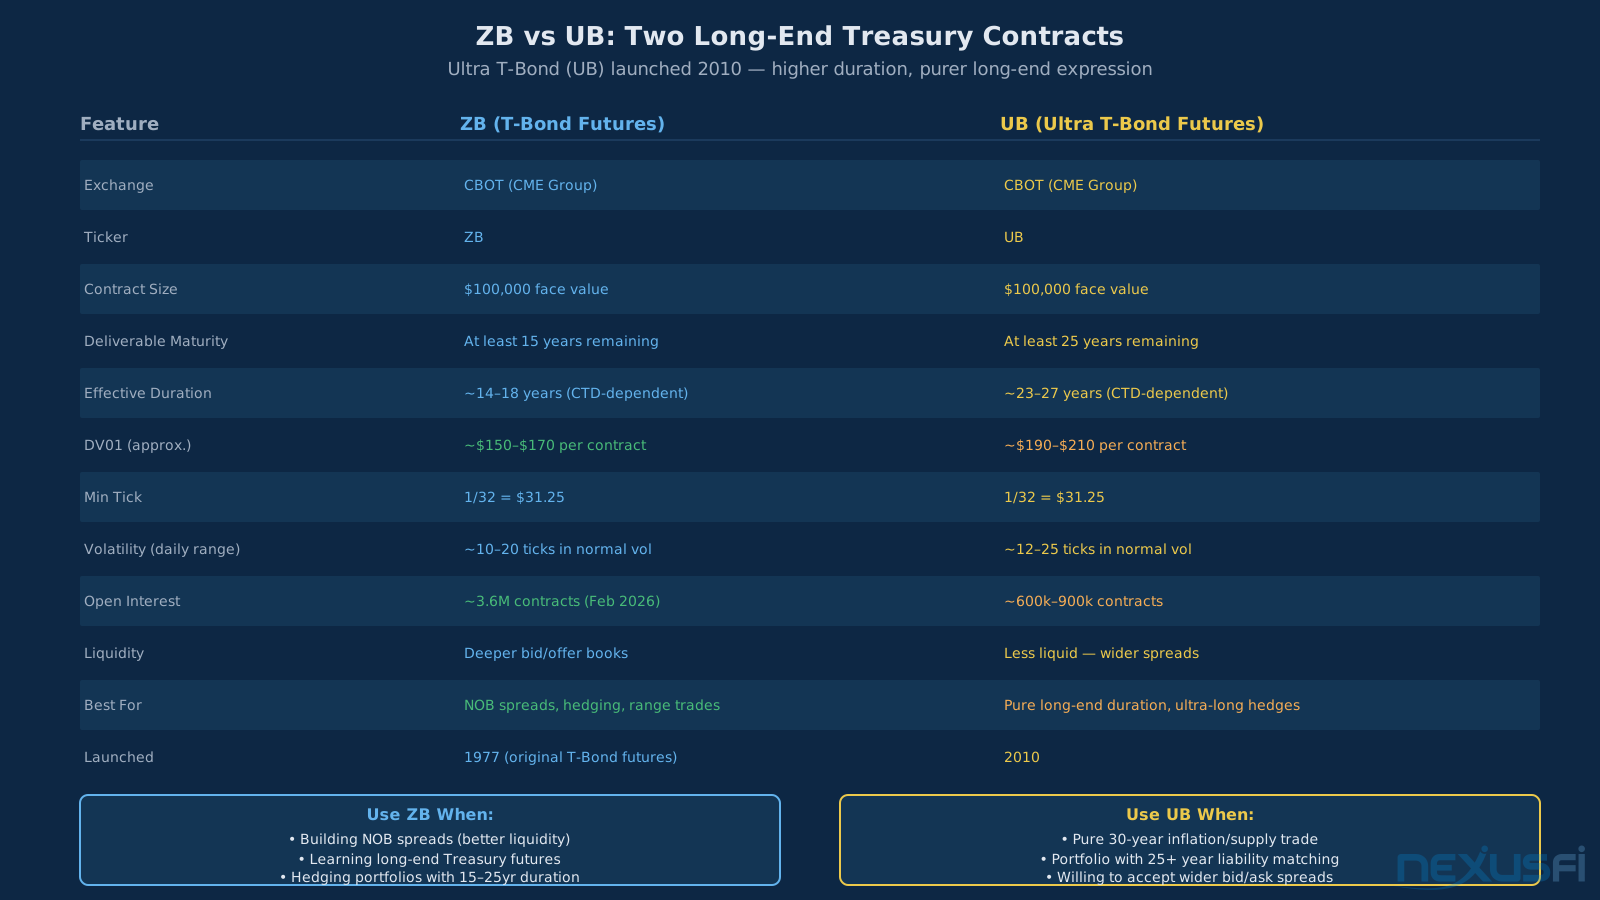
In 2010, CME launched the Ultra T-Bond futures (UB) to create a purer long-end contract. The key distinction:
- ZB: Delivers T-bonds with at least 15 years remaining to maturity. Because 30-year bonds issued years ago with 15+ years left are deliverable, ZB's CTD is often a bond with effective duration closer to 15-18 years than 30 years.
- UB: Delivers T-bonds with at least 25 years remaining to maturity. This keeps the CTD genuinely "long" -- 25+ year duration bonds only. The result is a purer 30-year rate expression with higher DV01 (~$190-210 vs ZB's ~$150-170).
Despite UB's superior purity as a long-end instrument, ZB retains dominant liquidity. Open interest in ZB runs 3-5× that of UB. Bid/offer spreads in ZB are tighter. The NOB spread universe uses ZB by convention. Most institutional hedgers remain in ZB because the existing infrastructure — spread markets, calendar roll markets, options chains — is deeper and more liquid.
For most traders, ZB is the right choice. Use UB when you specifically need the higher-duration, purer-30-year expression and you're willing to accept wider bid/offer spreads in exchange for that purity.
Putting It Together #
ZB demands a different framework than most futures. The DV01 of roughly 0 per basis point makes position sizing the non-negotiable first discipline — not technicals, not setup selection. Size by DV01. Never count contracts.
The macro context comes before entries. Treasury auction results, PCE inflation trends, and long-run rate expectations are more important for ZB direction than any intraday chart pattern. Know whether you're in a rate cycle or a range environment before you touch a position.
The NOB spread (2 ZN vs. 1 ZB) is often a better trade than outright ZB when you want long-end exposure without pure directional rate risk. Use it when you have a view on the 10/30 yield curve slope.
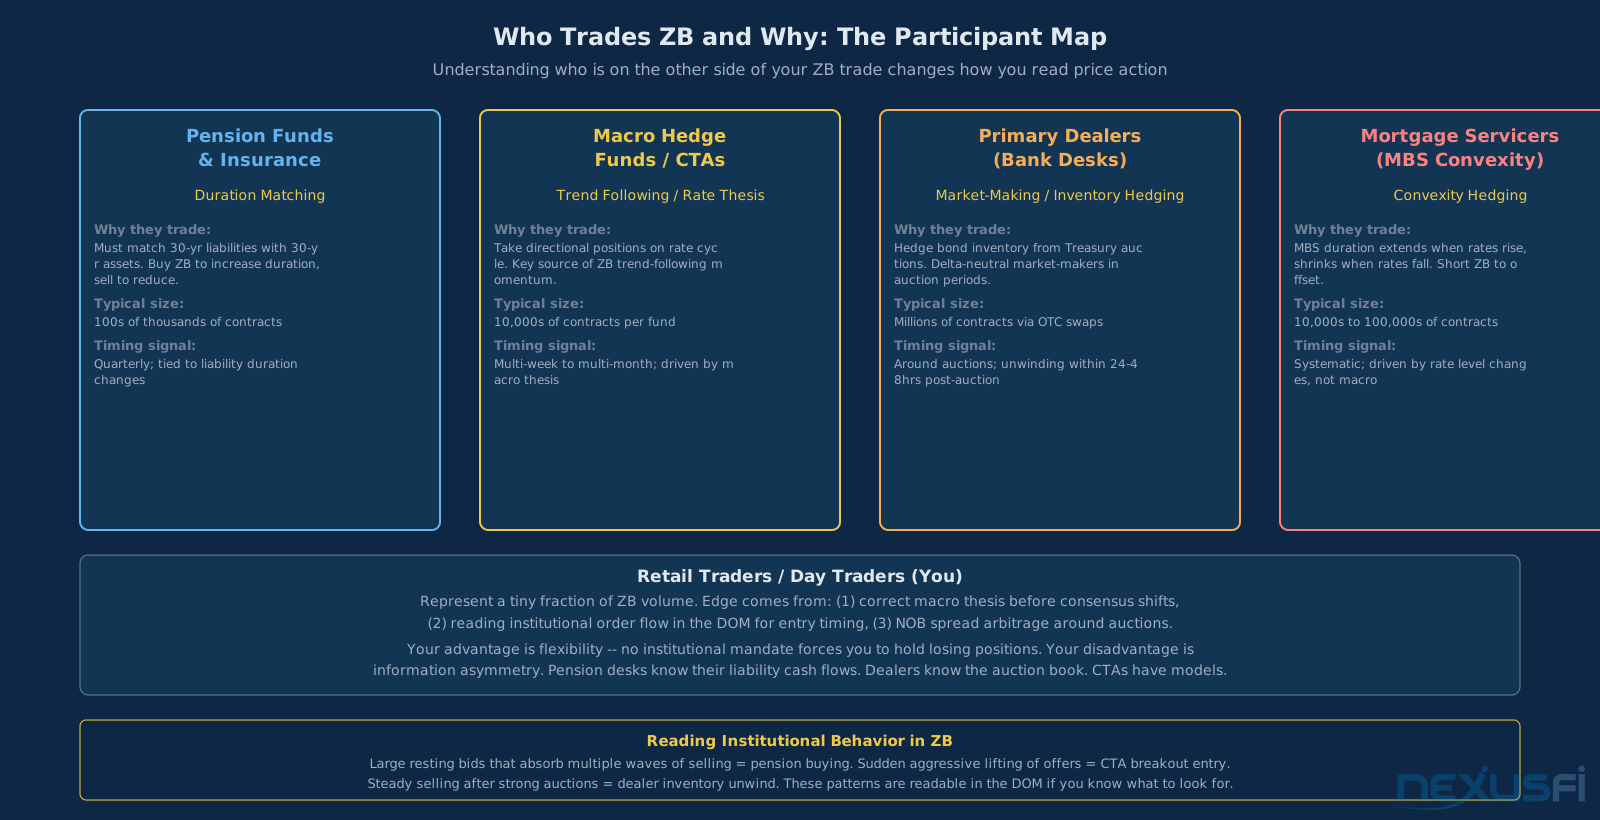
Last: respect the participants on the other side. Pension funds, insurance companies, and macro hedge funds are running ZB positions against billion-dollar duration mandates. tigertrader's advice from 30 years on the CBOT floor still holds — if your time frame is short enough that the noise drowns out the thesis, the time frame is wrong. ZB rewards patience and macro conviction. It punishes undercapitalized impatience.
Citations and Community Sources #
- Fi: "CME Treasury Open Interest Surges to Record 36.3 Million Contracts" -- NexusFi Treasury Notes and Bonds, Feb 2026.
- jstnbrg: "ZB ZN (NOB)" -- duration and ratio explanation -- NexusFi Treasury Notes and Bonds, Jan 2011.
- rleplae: "Differences between ZB and ZN? -- Specs" -- NexusFi Treasury Notes and Bonds, Feb 2018.
- tigertrader: "30Yr. Bond Futures trading/scalping size ZB" -- NexusFi Treasury Notes and Bonds, May 2020.
- tigertrader: "Why short-term ZB trading is counterproductive" -- NexusFi Treasury Notes and Bonds, May 2020.
- jstnbrg: "NOB spread ratio -- 2:1 to 5:3 historical range" -- NexusFi Treasury Notes and Bonds, Jan 2011.
- Schnook: "What to watch in ZB order book vs. what trades" -- NexusFi Treasury Notes and Bonds, May 2022.
- dsheehan87: "ZB scalability and order flow compared to ZN" -- NexusFi Treasury Notes and Bonds, May 2022.
- ZBTrader: "Trading ZB with volume at price" -- NexusFi Commodities, Feb 2015.
- Fat Tails: "Session Toolbox -- ZB session times in CT" -- NexusFi Elite Circle, Jan 2017.
- wshi88: "30 Year Bond (ZB) Daytrading Journal" -- NexusFi Trading Journals, Sep 2015.
- tigertrader: "10 lots in Bonds needs at least $100k account" -- NexusFi Treasury Notes and Bonds, May 2020.
- tigertrader: "ZB liquidity absent during QE -- not trading Bonds" -- NexusFi Treasury Notes and Bonds, May 2020.
Knowledge Map
Go Deeper
Build on this knowledgeReferences This Article
Articles that build on this topicCitations
- — NexusFi Discussion (2026)“CME Treasury Open Interest Surges to Record 36.3 Million Contracts -- every tenor hit simultaneously”
- — NexusFi Discussion (2011) 👍 5“ZB is roughly twice as big as ZN in daily range; duration relationship and NOB ratio explanation”
- — NexusFi Discussion (2018) 👍 8“CL is a F16 jet plane, ZB is a jumbo ocean carrier -- volatility and maturity comparison”
- — NexusFi Discussion (2020) 👍 12“COVID supply surge: $3 trillion borrowing, bear steepening in 5/30 explained”
- — NexusFi Discussion (2020) 👍 15“Short-term ZB trading counterproductive -- random price action, algo competition, time frame matters”
- — NexusFi Discussion (2011) 👍 5“NOB spread ratio 2:1 to 5:3 historical range”
- — NexusFi Discussion (2022) 👍 6“Watch traded volume not displayed size -- spoofing detection in ZB DOM”
- — NexusFi Discussion (2022) 👍 4“ZB scalable to 25 lots, ZN to 50 lots; ZB preferred when ZN order book unreliable”
- — NexusFi Discussion (2015) 👍 3“Pure volume-at-price trading in ZB: 1,000+ contracts at level, trade the reaction”
- — NexusFi Discussion (2017) 👍 7“ZB session template: full session 5:00 PM CT to 4:00 PM CT following day”
- — NexusFi Discussion (2015) 👍 2“ZB daytrading journal: 6-tick stop, retracement to 20/50 EMA, morning focus”
- — NexusFi Discussion (2020) 👍 9“10 ZB contracts requires at least $100k account -- capital requirements for serious size”
- — NexusFi Discussion (2020) 👍 15“ZB liquidity absent during QE -- not trading bonds during Fed distortion”