



0DTE Options on Futures: The Complete Guide to Same-Day Expiration Trading on ES and NQ
Overview #
0DTE options on futures are same-day expiration contracts — options that expire the day you buy or sell them. On the ES (S&P 500 E-mini), that means Monday, Wednesday, and Friday expirations every week. On the NQ, it's primarily Friday. The contracts themselves aren't new, but their dominance is: by 2022, 0DTE options accounted for roughly 50% of all daily S&P 500 options volume — a structural shift that permanently altered how ES and NQ move intraday.
If you're trading ES or NQ futures and ignoring 0DTE options flow, you're flying blind past one of the biggest drivers of intraday price action that currently exists. Market makers who sell these options must hedge their delta exposure continuously by buying or selling the underlying futures. That hedging creates identifiable patterns: strike magnets, gamma-driven momentum bursts, and late-session volatility spikes that have nothing to do with news or fundamentals.
This article covers everything a serious futures trader needs to know: the mechanics of weekly expirations, gamma regime theory, how dealer hedging moves your futures price, practical strategies for both options traders and futures-only traders, risk management for an environment where 10-point ES moves in 30 minutes are routine, and the tools to monitor it all in real time.
You don't need to trade 0DTE options to benefit from understanding them. Knowing when the gamma regime is positive or negative — and where the key strike concentrations sit — gives you a structural edge over traders who are watching only price. The options market is driving the bus on expiration days.
What 0DTE Options Actually Are #
The "0" stands for zero days to expiration. These are options contracts where today is expiration day. You can buy them Monday morning and they're done by Monday afternoon. The theta decay that typically plays out over weeks collapses into hours. The gamma that builds slowly over a multi-week option's life explodes into a single session.
In the context of futures options on the CME, 0DTE means:
- ES (S&P 500 E-mini) weekly options: Monday, Wednesday, and Friday expirations. CME introduced Monday and Wednesday expirations in 2022, tripling the frequency of 0DTE events for ES traders.
- NQ (Nasdaq-100 E-mini) weekly options: Primarily Friday expirations, though the schedule continues to evolve.
- Micro E-mini options (MES, MNQ): Same expiration structure as full-size contracts, with 1/10th the notional — accessible for smaller accounts studying the 0DTE dynamic without full ES capital requirements.
ES options are European-style — no early exercise. They settle to the underlying futures price at expiration via CME cash settlement mechanics. No early assignment risk, no hedging complexity from exercise. All the hedging pressure flows purely from delta management as expiration approaches.
One distinction that trips up traders new to this space: 0DTE options on ES futures aren't the same as 0DTE on SPX equity options, even though both reference the S&P 500. ES options settle into the futures contract, and the futures have their own basis and roll dynamics. The hedging flows overlap heavily — SPX 0DTE dealers also hedge in ES futures — but the instruments differ, and you can find yourself with two separate gamma exposures layered onto the same underlying futures.
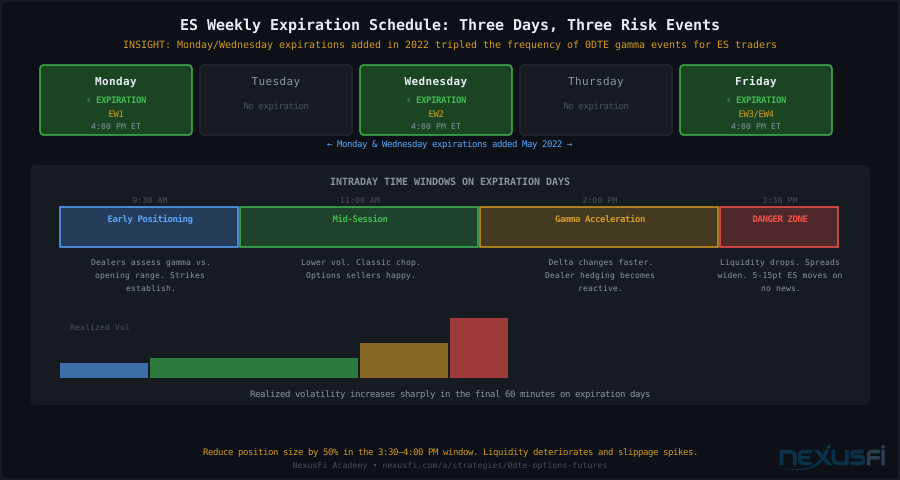
The ES Weekly Expiration Schedule #
Understanding the ES expiration calendar is non-negotiable for any serious intraday ES trader. Here's the full structure:
| Expiration Type | Days Available | Settlement | Introduced |
|---|---|---|---|
| Weekly (EW1) | Monday | 4:00 PM ET | 2005 (expanded 2022) |
| Weekly (EW2) | Wednesday | 4:00 PM ET | 2022 |
| Weekly (EW3/EW4) | Friday | 4:00 PM ET | Standard |
| Monthly (ES) | Third Friday | Quarterly cash settle | Original |
The Monday/Wednesday/Friday schedule means three times per week a massive slug of open interest is going to zero value within hours. On heavy expiration days, total open interest in expiring ES options can represent hundreds of billions in notional exposure. That OI has to be settled, and the delta-hedging that happens as it unwinds moves futures prices.
The critical time windows every expiration-day trader needs to know:
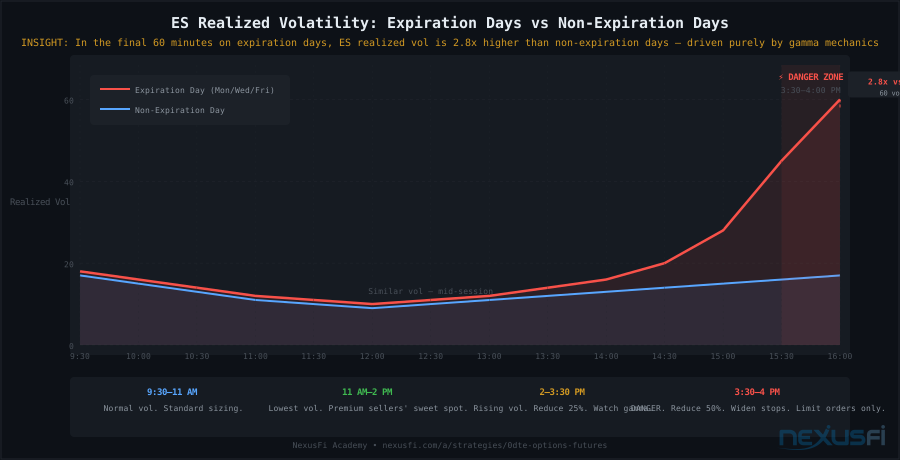
- 9:30 AM — 11:00 AM ET: Initial positioning. Dealers assess gamma exposure relative to the opening range. Strike relationships establish early. This is where you learn what the dominant strike is for the day.
- 11:00 AM — 2:00 PM ET: Mid-session lull. Often lower volatility as gamma exposure is relatively balanced. Classic chop period on low-conviction days. This window is often where mean-reversion fades work best in positive gamma environments.
- 2:00 PM — 3:30 PM ET: Gamma acceleration zone. As expiration approaches, gamma per contract spikes. Dealer hedging becomes more reactive and less predictable. Trend moves that started mid-session can accelerate here.
- 3:30 PM — 4:00 PM ET: Final 30-minute window. This is where the most extreme moves occur. Liquidity deteriorates, spreads widen, and hedging cascades can produce 5-10 point ES moves in minutes with no news trigger.
The final 30 minutes before ES expiration is not the same market you were trading at 10:00 AM. Reduce position size, widen your stops, and respect the possibility of violent moves in either direction driven purely by mechanical hedging pressure.
Gamma: The Engine Behind 0DTE #
Gamma is the rate at which an option's delta changes as the underlying price moves. For a standard option with 30 days to expiration, gamma is small — a 1-point move in ES might shift the option's delta by 0.02 or 0.03. For a 0DTE option trading near the money, gamma can be 10x to 50x higher. A 1-point ES move shifts the delta by 0.20 to 0.50.
Why does that matter? Because market makers who are short those options must hedge their delta exposure by buying or selling ES futures. High gamma means those hedges need to be adjusted constantly and aggressively as price moves. The hedging generates order flow that moves the market, which changes the delta again, requiring more hedging. It's a feedback loop — and on expiration days, that loop runs every minute.
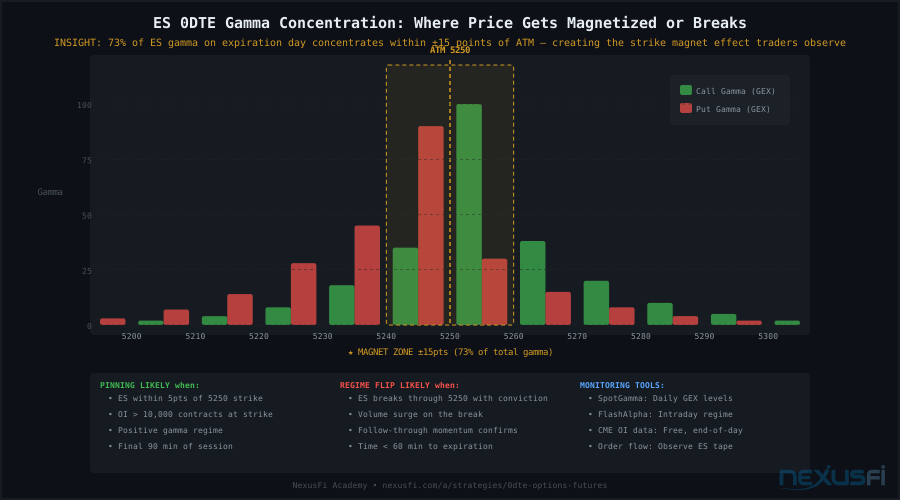
The gamma profile on expiration day concentrates around at-the-money (ATM) strikes. If ES is trading at 5,250 and there's a 5,250 strike with massive open interest, the gamma at that strike is extreme. Every tick through 5,250 forces significant delta adjustments from market makers who are short those options. This is why you see ES "magnetized" to specific round numbers or high-OI strikes on expiration days — the hedging dynamics create self-reinforcing price behavior.
Gamma Regimes: Positive vs Negative #
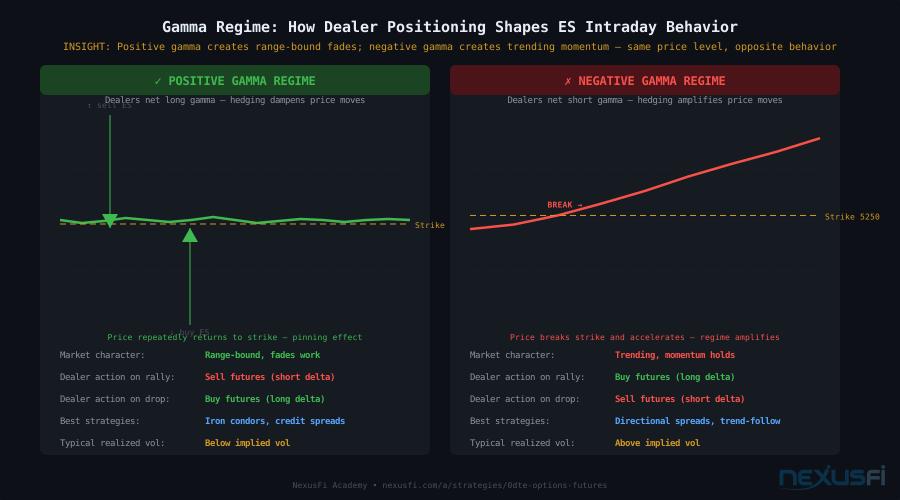
The single most important concept for understanding how 0DTE options affect futures price action is the gamma regime. The regime determines whether dealer hedging dampens or amplifies market moves.
Positive Gamma Regime — Dealers are net long gamma:
- When price rises, dealers' delta exposure goes long, so they sell futures to stay delta-neutral, dampening the move
- When price falls, dealers' delta exposure goes short, so they buy futures, again dampening the move
- Result: range-bound, mean-reverting price action. Fades work. Trend-following gets chopped up.
- Typical behavior: tight intraday ranges, price gravitating back to key strikes, low realized volatility relative to implied
Negative Gamma Regime — Dealers are net short gamma:
- When price rises, dealers' delta exposure goes short, so they buy futures, amplifying the move
- When price falls, dealers' delta exposure goes long, so they sell futures, amplifying again
- Result: trending, volatile price action. Breakouts follow through. Fades get punished.
- Typical behavior: large intraday ranges, momentum continuation, spike-and-hold patterns
The regime isn't static. It can switch during the session as price crosses key strikes, as open interest changes, and as expiration approaches. A market in positive gamma territory at 9:30 AM can flip to negative gamma by 2:00 PM if ES moves through the primary strike concentration. That switch is often invisible to traders using only price charts — which is exactly the structural edge that 0DTE-aware traders have.
Research from IBKR's analysis finds that the net gamma exposure of market makers is often more balanced than raw open interest suggests — many dealer positions offset each other. But the intraday microstructure effects are real and tradeable even if the systemic risk is lower than initially feared.
Positive gamma = mean reversion, fade the edges. Negative gamma = momentum continuation, don't fade a break. Identifying the regime before you trade — and knowing where it would flip — is the single biggest edge 0DTE awareness gives you.
How 0DTE Flow Moves ES and NQ Futures #
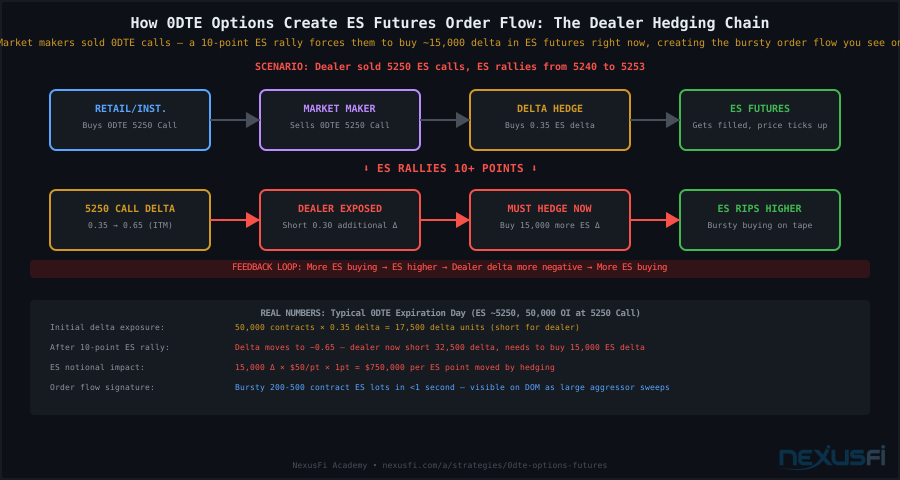
The transmission mechanism from 0DTE options to futures prices is direct: market makers hedge in futures. SPX options — the equity-index counterpart to ES futures options — are also hedged primarily in ES futures because of the liquidity and efficiency of that market. This means 0DTE activity in SPX equity options also moves ES, layering two separate gamma exposures onto the same underlying futures.
The order flow from dealer hedging has identifiable characteristics on the tape:
- Bursty, aggressive execution: Dealer hedges often come as market orders when the underlying moves rapidly, creating visible aggressor pressure on the tape — large lot transactions hitting the offer or lifting the bid in rapid succession
- Concentration around specific price levels: Hedging activity accelerates as ES approaches high-OI strikes, then abruptly shifts character as it crosses through
- Liquidity withdrawal near expiration: As market makers manage their expiring positions, bid-ask spreads in options widen, and the corresponding hedging flow becomes less predictable and more impactful on futures price
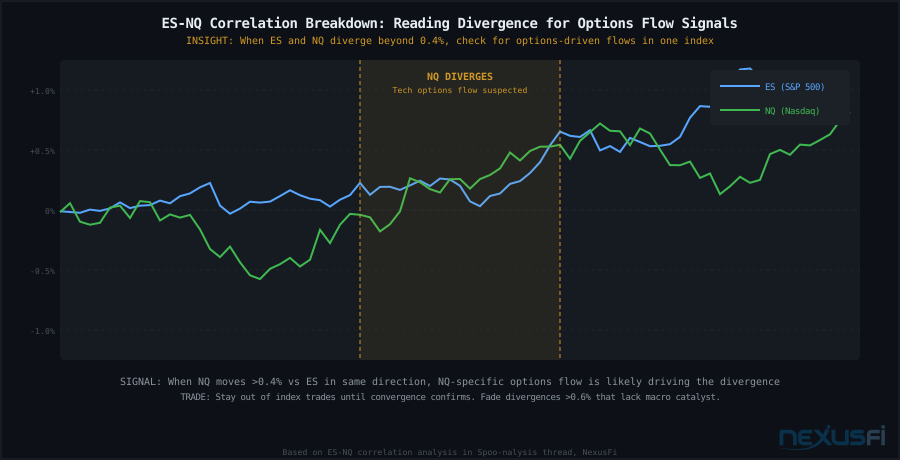
- Cross-market effects: Because ES and NQ share macro correlations but have different option market structures, divergent behavior between the two instruments often signals options positioning rather than fundamental divergence
A concrete example: on a Friday expiration day, if there's 50,000 contracts of open interest at the ES 5,250 calls and ES is trading at 5,247, those call options have a delta of approximately 0.35. Dealers who sold those calls are short 0.35 delta per contract — about 17,500 delta equivalents net short. If ES rallies to 5,253 and those calls go in-the-money, the delta rockets toward 0.65. Dealers now need to buy approximately 15,000 additional delta units in ES futures, right now, aggressively, because gamma is extreme. That buying is what you see as the "rip higher" that appears from nowhere on the tape.
Strike Pinning and the Magnet Effect #
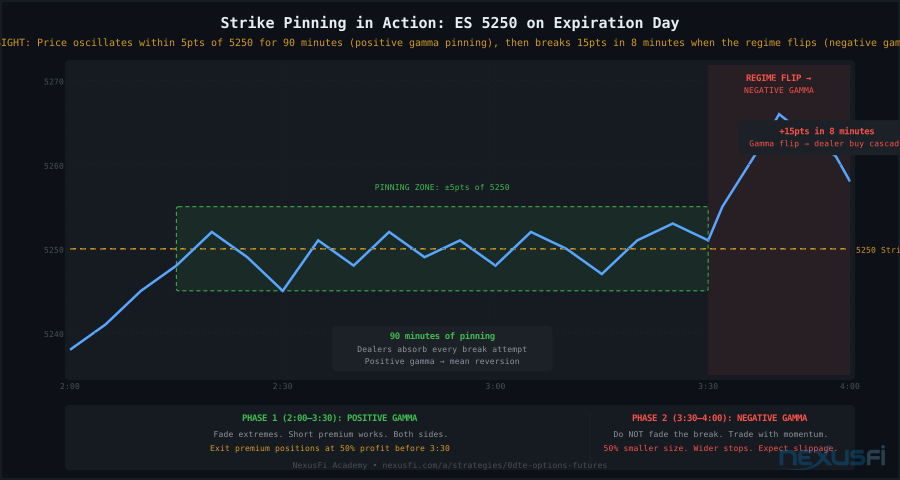
One of the most consistently observed 0DTE phenomena is strike pinning — the tendency of ES futures to gravitate toward and hover near specific strike prices as expiration approaches. The mechanism: as the underlying approaches a high-OI strike, dealers short options at that strike begin adjusting hedges. In positive gamma territory, their hedging creates a stabilizing effect that keeps price near the strike. The feedback loop pins price.
Pinning is most pronounced when:
- Open interest at a specific strike is unusually large (typically 10,000+ contracts)
- The underlying is within 5-10 ES points of that strike within the last 2 hours of trading
- Implied volatility is declining, reducing probability of large moves that would break the pin
- No scheduled news trigger that could override the technical hedging pressure
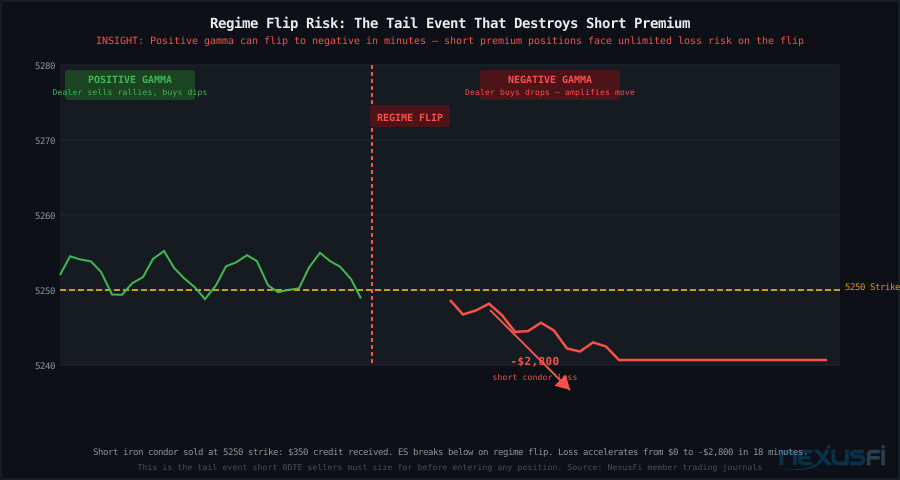
The counter-scenario — pinning failure — is when price breaks through a high-OI strike and the gamma regime flips from positive to negative. When this happens, dealer hedging amplifies the move rather than dampening it, producing the sharp directional breaks that often occur in the 45-60 minutes before expiration. These moves can be 5-15 ES points with minimal fundamental justification — purely mechanical unwinding.
The key insight: you can't assume hedging flows are always in one direction. The sign and magnitude depend entirely on whether dealers are net long or short gamma at each specific strike. A strike that's a magnet in positive gamma becomes a trap door in negative gamma.
Strategies for 0DTE Options Traders #
Trading 0DTE options directly requires a different mindset than multi-day or multi-week options strategies. You're managing an extremely time-compressed payoff structure where the entire bet resolves in hours. Here's how experienced traders approach it:
Premium Selling (Short 0DTE) #
The most popular 0DTE strategy in the NexusFi community is premium selling — specifically the methodology pioneered by forum member @ron99 in the "Selling Options on Futures?" thread, which has accumulated 7,370+ replies since 2013. Ron's core approach, originally designed for 90-110 DTE options, has been adapted by the community for the weekly/0DTE context:
- Strike selection: Sell OTM strikes at approximately 0.03-0.05 delta (roughly 15-25 ES points away from ATM on a normal volatility day). Lower delta means higher probability of expiring worthless, but less premium collected.
- Exit rule: Buy back when premium drops 50%. This harvests most of the theta decay while eliminating the risk of holding through final-hour volatility.
- Structure: Credit spreads (sell a strike, buy a further OTM strike) rather than naked short options. SPAN margin efficiency is worse with spreads, but defined risk is non-negotiable for retail traders. A naked short ES put in a gap-down open can blow past any stop.
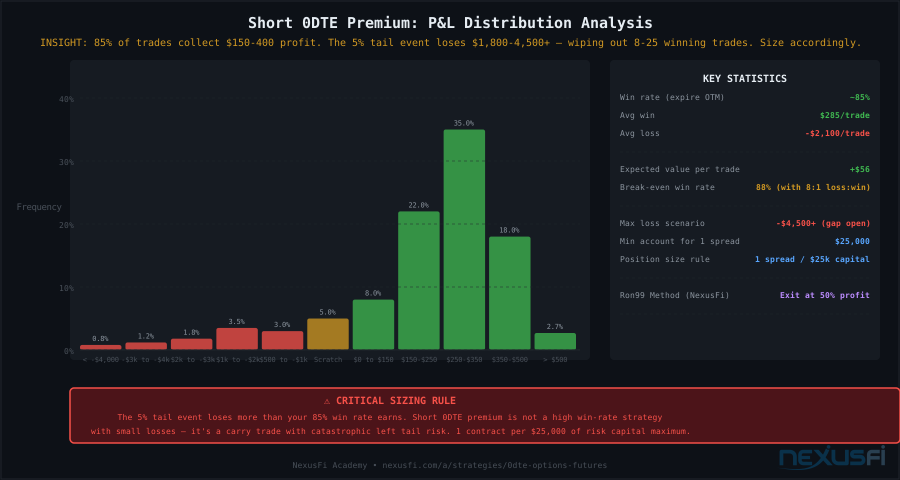
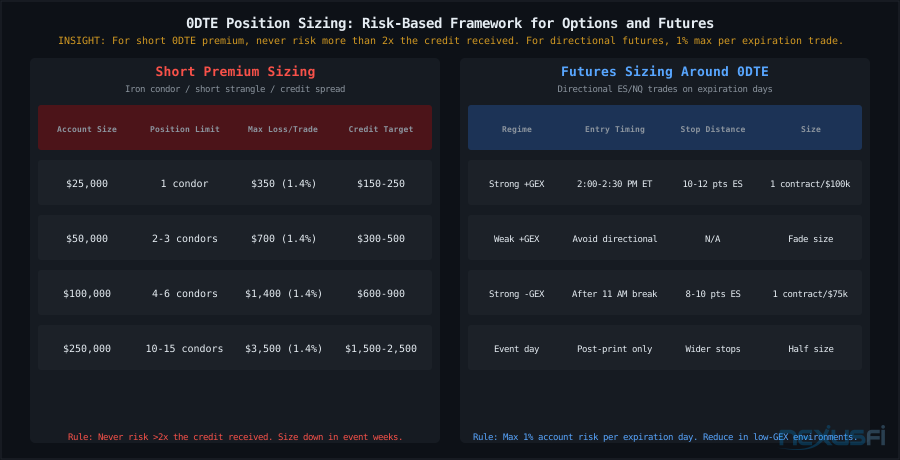
The key risk in short 0DTE premium is tail events. A 30-point ES gap on a geopolitical shock or surprise Fed announcement can turn a $200 credit into a $2,000+ debit in minutes. Position sizing must assume that the worst case is worse than any backtested scenario. At one credit spread per $50,000 of risk capital, you're sized appropriately. At ten credit spreads on a $50,000 account, you're playing with fire.
Long 0DTE (Directional) #
Buying 0DTE options on ES is a high-conviction directional play. Three conditions need to align:
- Clear directional bias — not "the market might go up," but a specific trigger driving a specific direction
- A trigger that will drive the move within hours (economic release, Fed commentary, technical break)
- The move must exceed the implied move. If ES 0DTE options are pricing a ±15-point daily range, a 12-point directional move still loses you money on long options even if you're right on direction
The most common mistake: buying 0DTE puts or calls expecting "a big move today" without accounting for the implied move already priced in. Theta decay on a 0DTE option is brutal in the final hour — an ATM ES option that costs $800 at 10 AM might be worth $400 at 2 PM with ES unchanged. You're fighting direction and time simultaneously.
Defined-Risk Structures (Spreads, Butterflies) #
For 0DTE, defined-risk structures are the professional standard:
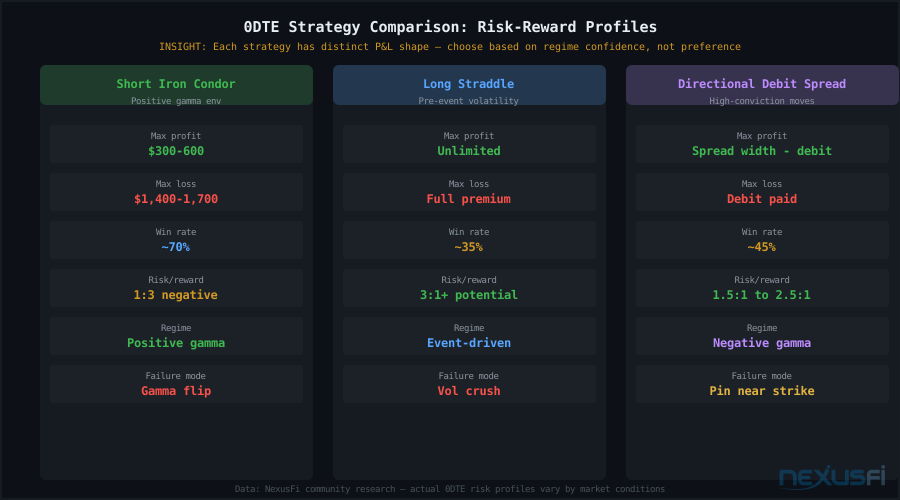
- Credit spreads: Sell the ATM-15 strike, buy the ATM-25 strike. Collect $300-500 credit, maximum loss is the spread width minus credit. Works in positive gamma (range-bound) regimes.
- Iron butterfly: Sell ATM call and put, buy OTM protection on both sides. Maximum profit at expiration exactly at the short strike. High-probability in pinning scenarios.
- Iron condor: Sell OTM call and put (expecting range), buy further OTM on both sides. Classic positive-gamma play — works when ES stays within the expected move.
The bid-ask spread on an ES 0DTE option can be $1-3 in normal conditions and $5-10 near expiration. Structure entries with limit orders at the midpoint. Market orders on 0DTE options will cost you 10-20% of your potential P&L in slippage alone.
Strategies for Futures Traders: Trading Around 0DTE Flow #
You don't need to trade options to benefit from understanding 0DTE mechanics. Many of the most sophisticated ES day traders use options flow data purely as context for their futures trades.
Gamma Regime Identification #
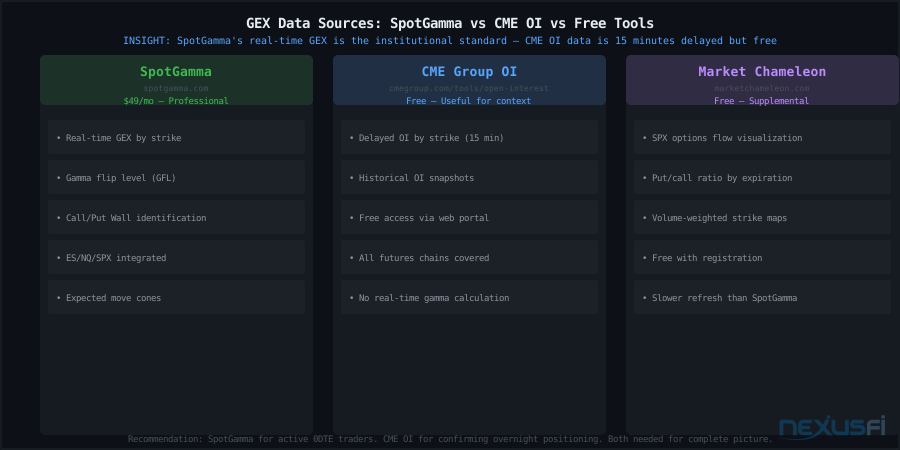
Establish the gamma regime before placing the first trade. Tools like SpotGamma publish pre-market GEX data showing whether the market is in positive or negative territory and where the key strike concentrations are. Without those tools, you can approximate the regime by observing price behavior in the first 30-60 minutes:
- Positive gamma indicator: Price moves to a level and reverses back, repeatedly. Opening range breaks fail. Fades from the extremes work.
- Negative gamma indicator: Price breaks a level and continues. Momentum holds. Failed reversals. Trend-following setups complete.
Strike-Level Awareness #
On expiration days, major round numbers (5,200, 5,250, 5,300 ES) and the previous session's high/low often coincide with high open interest strikes. These levels function as magnets when price is nearby and as directional catalysts when price breaks through. The 80% Rule from market profile applies here with extra force on expiration days: when ES is in the value area of a high-OI strike cluster, 80% of the time it will visit both extremes of that cluster by end of session.
Final-Hour Framework #
The 3:00-4:00 PM ET window is a distinct trading environment. Strategies that work in the morning often fail here.
In the final hour on expiration days: (1) reduce position size by 50%, (2) identify where the dominant open interest strike is — price will either pin there or blast through it, (3) don't fade a momentum break in negative gamma territory, and (4) watch for mean-reversion back toward the pin strike in the final 10 minutes as dealers close books.
Pre-close book-squaring in the final 10 minutes often reverts price toward the dominant pin strike as dealers unwind their hedges. This creates a brief mean-reversion opportunity that can contradict the preceding 30-minute direction. It's one of the more reliably exploitable patterns on expiration days — but the window is narrow and execution must be precise.
Risk Management: What Can Kill You #
0DTE trading has a higher concentration of account-ending scenarios than most strategies. The compressed timeframe means errors compound faster and recovery time shrinks to zero.
Regime Flip Risk #
The gamma regime can flip mid-session as ES crosses key strike levels. A trade perfectly aligned with morning's positive gamma (fade-the-move) turns into a loser the moment ES breaks through the primary strike and dealers switch from dampening to amplifying. Know where the regime would flip before entering any trade. This is a pre-trade requirement, not an exit condition.
Tail Event Risk for Short Premium #
Short 0DTE premium has a distribution that looks like: collect $200 most days, lose $2,000 occasionally. The occasional loss isn't random — it concentrates around surprise economic releases (CPI, NFP, FOMC outside scheduled meetings), geopolitical shocks that gap the futures market before the open, and negative gamma cascade days when dealer hedging amplifies a routine move into a 30-40 point selloff.
Position sizing for short 0DTE must account for a 50-point ES adverse move as a realistic scenario, not a tail case. At one credit spread per $50,000 of risk capital, you're sized appropriately. At ten spreads on a $50,000 account, you're not managing risk — you're gambling on the tail not showing up.
Liquidity Risk Near Expiration #
Bid-ask spreads in the final 30 minutes can widen dramatically. An option showing a $1.50 mid price might have a $0.50 bid / $2.50 ask — effectively a 100% spread. If you need to exit a losing position in this environment, you're paying a significant penalty. The solution: plan exits in advance. Your 50% profit target exit should already be a resting limit order, not a decision you make while price is moving against you.
The Vega Trap for Option Buyers #
Implied volatility on 0DTE options (for context on measuring IV, see Implied Volatility Rank for Futures Options) can spike 50-100% intraday. If you're buying 0DTE options for direction and IV collapses after entry — which happens frequently when the market goes nowhere after a morning fear spike — your option loses value even if you're directionally right. IV expansion matters for buyers, IV contraction matters for sellers. Get this backwards and you can be right on direction and still lose money.
ES-NQ Divergence as a Risk Signal #
When ES and NQ diverge much on an expiration day — one pinned near a strike while the other trends — it almost always reflects instrument-specific options positioning rather than a macro fundamental shift. Don't put on correlated positions expecting convergence. The divergence can widen further before it resolves. Treat it as a warning sign that the options market is driving price action, not as a pairs trade opportunity.
Tools and Monitoring #
Trading 0DTE dynamics without real-time data on gamma exposure is like trading volume profile without the volume profile visible. You can approximate the key levels, but you're missing the precision that separates consistent traders from reactive participants.
SpotGamma #
The market leader in retail-accessible GEX data. SpotGamma publishes daily gamma exposure charts for ES (and SPX/SPY) — a real-time overlay on the concepts described in the Academy's Options Flow Analysis and Gamma Exposure guide, showing the net dealer gamma position by strike. Key metrics: the overall GEX level (positive or negative reading), key strikes where the largest gamma concentrations exist (your pin candidates and regime-flip levels), and the expected move for the session based on positioning data rather than just implied volatility.
SpotGamma is a NexusFi sponsor and conducted an AMA in the Options forum — their direct engagement with the community provides specific guidance on applying their data to ES and NQ futures trading.
CME Open Interest Data #
Free and authoritative. CME publishes end-of-day open interest by strike for all ES options expirations. By identifying the largest OI strikes for tomorrow's expiration, you can build a basic strike map without any subscription service. It's less precise than real-time GEX tools — no regime-flip identification, no intraday updates — but it identifies the major levels that matter.
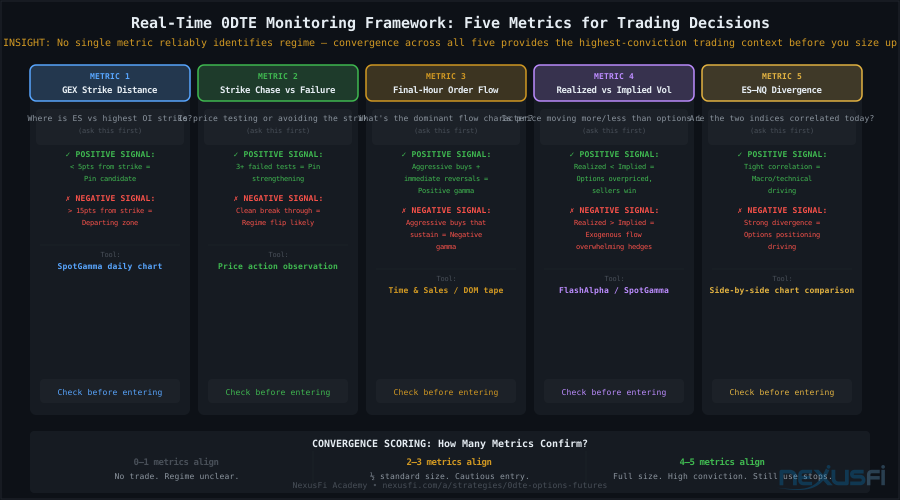
Five Metrics to Monitor During the Session #
- Where is ES relative to the highest OI strikes? Within 5 points = pin candidate. 10+ points away = approaching or departing the magnet zone.
- Is price chasing or failing at those strikes? Three failed tests of a strike level signals pinning in action. A clean break through signals potential regime flip.
- What is the order flow character in the final hour? Aggressive buying bursts followed by immediate reversals = positive gamma dampening. Aggressive buying that sustains = negative gamma amplification.
- Is realized volatility exceeding implied? If ES is moving more than the options-implied daily range suggests, options hedging is being overwhelmed by exogenous flow (news, technicals, institutional repositioning).
- ES-NQ divergence? When they diverge on an expiration day, instrument-specific options positioning is driving the move. When they correlate tightly, macro or technicals are in control.
The Community Perspective #
NexusFi has been tracking options flow and its impact on ES futures since the community's earliest days. The Spoo-nalysis thread by @tigertrader — with 38,000+ replies covering more than a decade of daily ES analysis — is one of the most detailed real-time analyses of options-futures interaction anywhere on the internet. The thread discusses GEX, dealer positioning, and expiration dynamics in real time, making it a living resource for understanding how the community's most sophisticated traders think about these mechanics.
The "Selling Options on Futures?" thread started by @ron99 in 2013 remains active 12+ years and 7,370+ replies later — testament to how central premium selling on ES futures options is to the NexusFi community's trading approach. The strategies discussed there have evolved much as the 0DTE market structure developed, with members like @SMCJB and @TFOpts contributing systematic analysis of how the weekly expiration schedule affects optimal entry timing and strike selection.
The consensus from the community's most experienced options and futures traders: 0DTE isn't a gimmick or a retail phenomenon. It's a structural feature of the current ES market that creates identifiable, repeatable patterns. Understanding gamma regimes, respecting the final-hour risk environment, and using GEX data as a context layer doesn't require trading options. It makes you a better futures trader.
0DTE options now drive roughly 50% of S&P 500 daily options volume and are a primary mover of ES/NQ intraday price action through dealer delta-hedging in futures. The gamma regime — positive or negative — determines whether the market is range-bound or trending on any given expiration day. Strike pinning is real, the final hour is dangerous, and understanding these mechanics gives you an edge whether you trade options or not.
Knowledge Map
Go Deeper
Build on this knowledgeReferences This Article
Articles that build on this topicCitations
- — SpotGamma AMA - Ask Me Anything About Options Flow & Gamma Analysis (2026) 👍 1“Mechanically, ES and NQ traders should be watching gamma exposure for the underlying index, since SPX and NDX options are hedged first and most directly in the futures market.”
- — Selling Options on Futures? (2015) 👍 35“I sell around 0.0300 deltas at 90-110 DTE and buy back when premium is 50% gone. I keep 3 times the initial margin required for each put for the entire time I hold the option.”
- — Spoo-nalysis ES e-mini futures S&P 500 (2022) 👍 9“The closer the option gets to expiration the larger the gamma grows. A move lower could result in a transition to negative gamma exposure, that would spike vol and change hedging needs.”
- — Spoo-nalysis ES e-mini futures S&P 500 (2020) 👍 18“The market makers or dealers have complex positions and different methods and ideas about what to do with those positions. Eventually and often around expiration there will be tremendous pressure around high gamma strikes.”
- — Spoo-nalysis ES e-mini futures S&P 500 (2020) 👍 13“This market is trading a lot like a positive gamma market in that the mean reversion and movement between strikes with large open interest is very transparent. The hedging volume tied to options trading is a dominant percentage of volume.”
- — Selling Options on Futures? (2020) 👍 6“11:49 Friday 30th with ES at 3254 the EW1 3255 straddle is worth 156. That's a premium equal to 4.8% of the underlying for a 1 week option. The 3090/3415 Strangle (both strikes 5% out of the money) is worth 43.5 -- a premium equal to 1.3% so in 'it ain't ever going there' math it gives away a lot to lose a lot.”
- — SpotGamma AMA - Ask Me Anything About Options Flow & Gamma Analysis (2024) 👍 3“For ES day traders using SpotGamma, we would suggest starting with pre-market support & resistance levels. These integrate directly into other trading platforms with a simple CSV upload. GEX shows you where the market has elevated hedging sensitivity -- and at those levels, you often see increased price magnetism or explosive moves through them.”
- — Lady Vol's Primer: Trading Volatility Journal (2025) 👍 4“The options market prices in a certain range based on IV. That range compresses in the first hour and expands dramatically in the final 30 minutes of expiration days. Measuring the opening range against the expected move tells you whether the market has room to run or is already exhausted.”
- — Selling Options on Futures? (2017) 👍 8“The scenario that worked best is to buy the puts when you reach about 50% of margin. Higher than 50% and the puts aren't protective enough; lower than 50% and you're giving up too much premium early. On 0DTE trades, the margin-to-premium relationship is even more compressed -- you need hard stops, not hedges.”
- — Selling Options on Futures? (2023) 👍 7“Options expiring on a given day can create massive dislocations. The SVB situation showed what happens when high-OI puts go to full value unexpectedly -- the pin risk, exercise decisions, and dealer hedging all happen in real time. For 0DTE traders, this is the tail scenario that position sizing must account for.”